A powerful return on investment calculator in Excel is much more than a spreadsheet. For RevOps, marketing, and sales operations leaders, it’s the bridge between daily activities and the financial narrative your leadership team needs to see. It’s how you justify MarTech spend, prove the value of your team, and build a defensible business case for your entire go-to-market (GTM) strategy.
Why Your CRM Dashboards Are Not Enough
The out-of-the-box dashboards in Salesforce Sales Cloud or HubSpot are great for a real-time pulse check on crucial operational metrics—lead velocity, conversion rates, pipeline value. They are essential for seeing what’s happening right now.
But they are reporting tools, not financial models. They tell you the “what” but rarely the full “why” or, more importantly, the true total cost behind the results.

This is precisely where a custom-built Excel model becomes indispensable for any serious RevOps or marketing operations leader. Standard CRM dashboards fall short in a few critical areas.
Capturing the Total Cost of Investment
Your MarTech stack costs far more than the monthly subscription fee. A credible ROI analysis must account for the complete financial picture, and your CRM dashboard simply isn’t built for that. These often-overlooked costs can fundamentally change the business case for a new tool, system audit, or strategic project.
With a dedicated Excel model, you can centralize all nuanced expenses in one place:
- Implementation & Onboarding: The fees paid to a consultant for a Salesforce or HubSpot setup, data migration, or system audit.
- GTM Engineering Tools: Licenses for essential supporting tools like ZoomInfo for data enrichment or Clay.com for outbound orchestration that power your team but live outside the CRM.
- Internal Team Hours: The cost of your team’s time spent on training, adoption, and managing a new platform is a real, tangible expense.
- Integration & Maintenance: The costs associated with connecting systems and ensuring clean data flows between your marketing automation and CRM platforms.
Ignoring these “soft” and one-time costs presents a skewed, overly optimistic ROI figure that undermines credibility.
A well-built spreadsheet becomes your single source of truth for financial validation. It’s the asset you use to justify new MarTech, secure executive buy-in for RevOps initiatives, and align the revenue team around clear financial goals.
Connecting Activities to Financial Outcomes
Ultimately, RevOps exists to drive predictable revenue. While a HubSpot dashboard might show a campaign generated 500 MQLs, a custom return on investment calculator in Excel can model how those MQLs convert into revenue, factoring in your company’s unique sales cycle, average deal size, and close rates. This provides granular insights into the performance of various marketing initiatives that generic dashboards cannot.
For example, you’re evaluating a new lead enrichment tool. A standard report might only show an increase in data completeness. Your Excel model, however, can draw a direct line from that investment to a measurable decrease in Customer Acquisition Cost (CAC) or an increase in sales velocity because reps spend less time on manual research.
This shift changes the entire conversation. You’re no longer discussing operational metrics; you’re demonstrating direct financial impact. That’s the language the C-suite understands.
Gathering the Right Data for Your ROI Calculation
Your ROI calculator is only as reliable as the data you feed it. The adage “garbage in, garbage out” is especially true in financial modeling. Before opening Excel, your first task is to become a data detective. You must gather the right inputs to give your calculations strategic weight.
A credible ROI model requires a solid grasp of the numbers, meaning a thorough Financial Statement Analysis is your starting point. You’ll need to break everything down into two categories: what you’re actually spending (the investment) and what you’re realistically getting back (the return).

What Did This Really Cost? Defining Your Total Investment
To calculate an honest ROI, you must capture every dollar spent. This goes far beyond the monthly software subscription fee. A complete picture of your investment costs is essential for building a business case that your CFO will approve.
Here’s what you need to track for the “cost” side of the equation:
- Software Licenses & Subscriptions: The easy part. Gather the annual or monthly fees for your core platform (e.g., Salesforce Sales Cloud, HubSpot Marketing Hub) and any add-on GTM tools like ZoomInfo or Clay.com.
- Implementation & Onboarding Fees: If you brought in a consultancy for the initial setup, a data migration, or a system audit, those one-time professional services fees are a critical part of your initial investment.
- Third-Party Integration Costs: Account for any middleware, connectors, or custom API development needed to ensure your systems communicate effectively.
- Internal Team Training: A frequently missed cost. Calculate the expense of your team’s time in training, plus the inevitable ramp-up period where productivity may temporarily decrease.
Capturing these “hidden” costs is non-negotiable. Forgetting to include $20,000 in agency implementation fees can artificially inflate your ROI and undermine your credibility when presenting your findings to leadership.
Where’s the Payoff? Pinpointing the Financial Returns
Once you have your costs documented, it’s time to identify the financial gains. The objective is to connect operational improvements to bottom-line results. We must move beyond vanity metrics and focus on numbers that directly impact revenue and profit. For RevOps leaders, the most significant wins typically come from efficiency gains and accelerated revenue.
Hunt for data in these key areas:
- Increased Revenue or Pipeline: The most direct return. Dive into your Salesforce opportunity reports or HubSpot deal analytics to identify the net new pipeline generated by the project.
- Reduced Customer Acquisition Cost (CAC): A smarter GTM motion should lower the cost to acquire a new customer. For example, if you’ve improved lead scoring in Account Engagement, your sales team can close deals faster, directly reducing your CAC. For a deeper dive, check out our guide on customer acquisition cost calculation.
- Improved Customer Lifetime Value (LTV): Better onboarding or more effective customer marketing campaigns can lead to higher retention and more upsells, directly boosting LTV.
- Increased Sales Velocity: A powerful metric. Measure the time from lead creation to a closed-won deal. If your new process shaves 10 days off a 90-day sales cycle, that’s a tangible return in the form of faster cash flow.
To provide a clearer picture, here’s a breakdown of the key metrics you’ll need to pull and why they matter.
Essential Metrics for Your ROI Calculator
This table breaks down the critical data points you’ll need, where you can typically find them within your CRM, and why each is vital for an accurate ROI calculation.
| Metric Category | Specific Metric | Primary Source (Salesforce/HubSpot) | Strategic Importance |
|---|---|---|---|
| Investment Costs | Software Licenses & Onboarding Fees | Finance/Procurement Records | Forms the baseline “I” (Investment) in the ROI formula. |
| Internal Team Labour (Implementation & Training) | HR/Project Management Tools | Captures the “hidden” opportunity cost of your team’s time. | |
| Revenue Gains | Net New Pipeline Generated | Opportunity/Deal Reports | Directly measures top-line growth attributed to the initiative. |
| Increase in Average Deal Size | Closed-Won Opportunity/Deal Reports | Shows if the initiative is driving higher-value sales. | |
| Efficiency Gains | Customer Acquisition Cost (CAC) | Marketing & Sales Expense Reports vs. New Customer Count | A lower CAC is a direct indicator of improved GTM efficiency and profitability. |
| Sales Cycle Length | Opportunity Stage History/Deal Funnel Reports | Measures sales velocity; a shorter cycle means faster revenue recognition. | |
| Customer Value | Customer Lifetime Value (LTV) | Customer Revenue Data & Churn Reports | Quantifies the long-term financial impact of improved customer retention and expansion. |
| Customer Churn Rate | Subscription/Customer Success Platform Reports | A lower churn rate is a primary driver of increased LTV and predictable revenue. |
Gathering this data meticulously is the difference between a rough estimate and a strategic tool. By being diligent on both the cost and return sides, you ensure your return on investment calculator in Excel becomes a reliable asset for making smarter business decisions.
Building Your Dynamic ROI Calculator in Excel
With your data gathered, it’s time to build the engine. We will translate those raw numbers into a dynamic, reusable financial model within Excel. This isn’t just about entering numbers into cells; it’s about creating a strategic asset that brings clarity to your go-to-market plans. A well-organized workbook is the difference between a powerful analysis tool and a spreadsheet nobody can make sense of.
The most common mistake is cramming everything—inputs, formulas, charts—onto one massive sheet, which becomes a nightmare to manage and audit. A superior approach, and standard practice for good reason, is to segment your workbook into dedicated tabs.
- Inputs Tab: This is your control panel. All variables—costs (software licenses, implementation fees, training hours) and return metrics (pipeline growth, reduced CAC)—are entered here and only here.
- Calculations Tab: This is the engine room. It pulls every number it needs from your ‘Inputs’ tab and houses all the formulas. Separating the logic keeps the model clean and prevents accidental errors.
- Dashboard Tab: This is the story—the presentation layer with key charts, summary tables, and high-level takeaways. All its data is sourced from the ‘Calculations’ tab. This is the sheet you present to leadership.
This segmented structure makes your calculator scalable. When a cost changes or a revenue assumption needs tweaking, you update it once on the ‘Inputs’ tab, and the entire model instantly recalculates.
Laying the Foundation with Core Formulas
With the workbook structured, we can begin entering formulas on the ‘Calculations’ tab. These are the foundational metrics that form the backbone of any solid ROI analysis. We’ll start with the basics before advancing to the B2B-specific metrics crucial for RevOps leaders.
The universal starting point is Simple ROI, which provides a clean, high-level percentage return. Let’s say your total net profit (Gain from Investment – Cost of Investment) is in cell C2 and the total cost of your investment is in cell A2. The Excel formula is:
=(C2/A2)*100
This calculation provides an immediate answer to the question: “For every dollar we invested, what did we get back?”
Next is the Payback Period. This metric indicates how long it will take for the investment to pay for itself—a key concern for your finance team. A simple and effective version is:
Initial Investment / Net Annual Cash Flow
This answers the critical follow-up question: “When do we break even?”
As you build it out, your calculator might look something like this, with a clear separation of concerns.
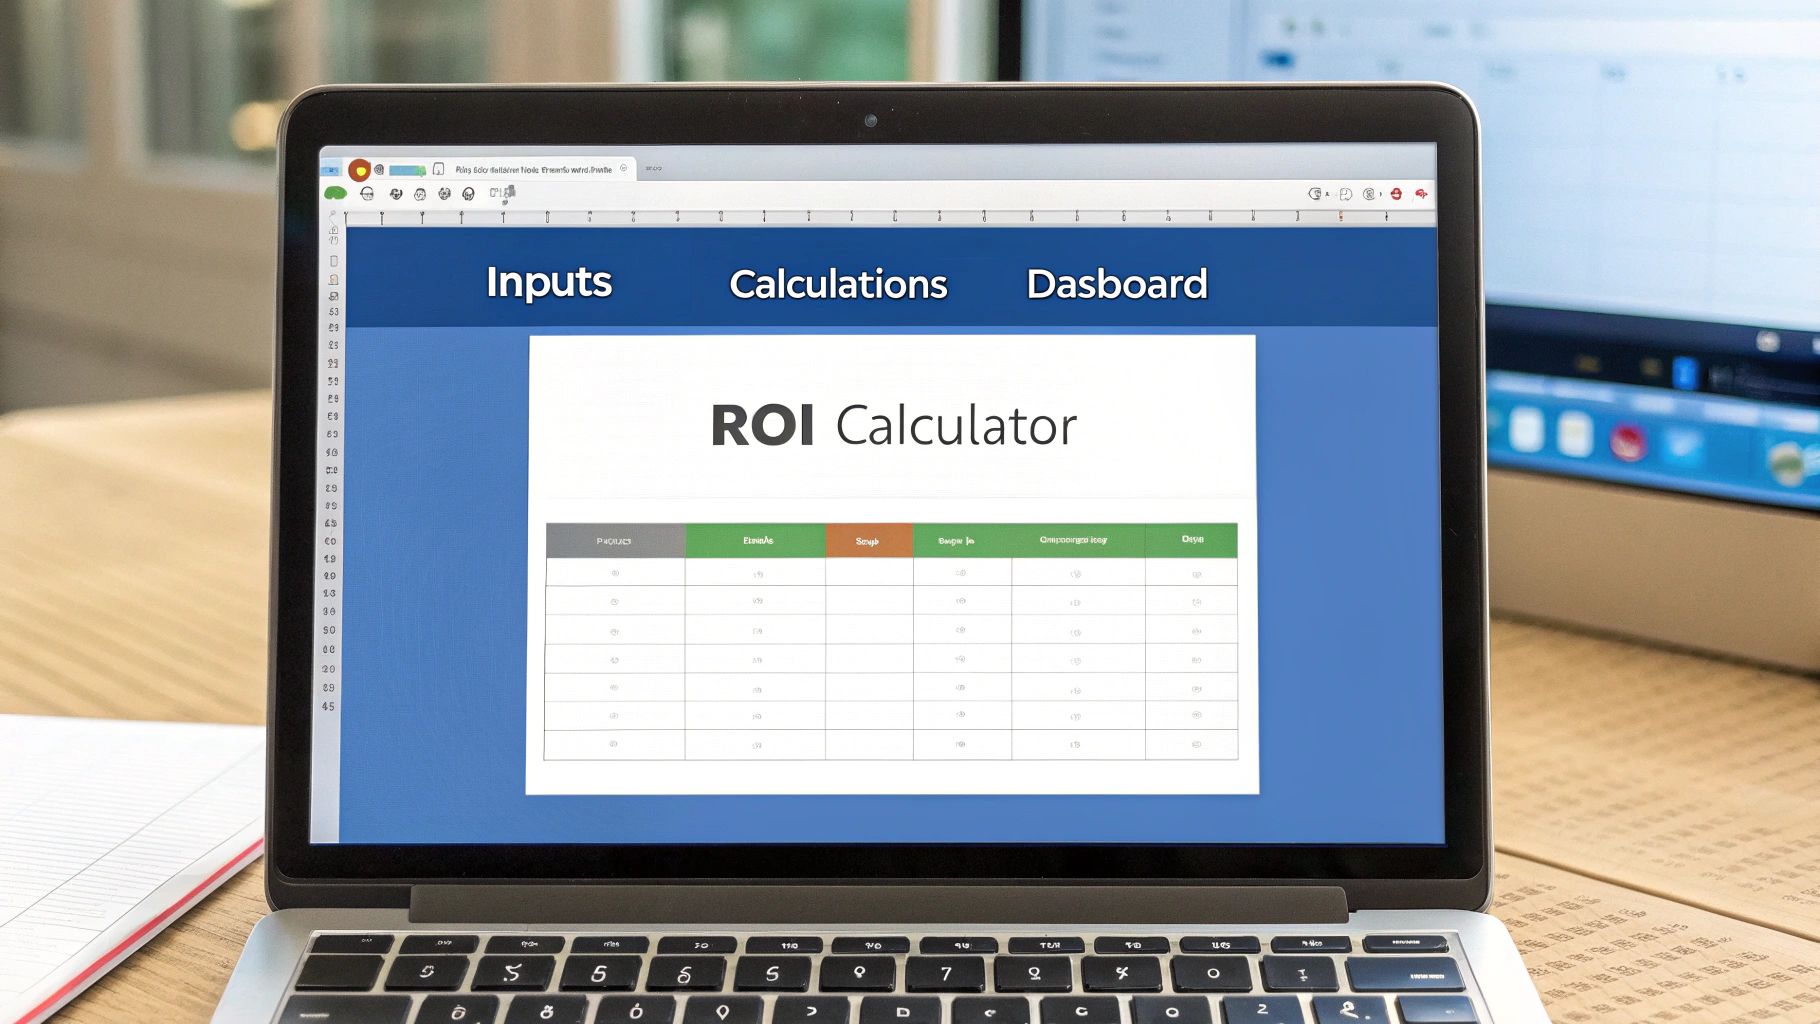
This structured layout makes the model both powerful for you and easy for others to interpret.
Advancing to RevOps-Specific Metrics
Simple ROI and Payback Period are table stakes. For a RevOps professional proving the value of a MarTech investment, we must go deeper. We need metrics that reflect the realities of B2B sales cycles, such as recurring revenue, customer churn, and long-term value.
The most critical of these metrics is the LTV:CAC Ratio, which compares the Lifetime Value of a customer to the Cost of Acquiring them. It’s the ultimate health check for a sustainable, profitable growth engine. A healthy ratio, generally 3:1 or better, signals that your GTM strategy is working. You can explore the specifics of this and other key calculations in our detailed guide on the essential ROI Excel formula.
Your Excel model should draw a direct line from operational improvements to this critical ratio. For example, if implementing Salesforce Account Engagement helps achieve a 15% reduction in churn, your model can show precisely how that boosts LTV and, in turn, your LTV:CAC ratio.
This is where a custom calculator truly excels. It allows you to model the real-world financial impact of specific operational wins, shifting the conversation from “we improved a process” to “we added $500,000 in enterprise value.”
Making Your Calculator Easy to Use
A brilliant calculator is worthless if your team cannot understand or use it. The final step is adding a layer of polish to make the tool accessible, even for stakeholders who are not spreadsheet experts.
Here are a few Excel features to improve clarity:
- Conditional Formatting: Excellent for instant visual feedback. Set it to automatically highlight positive ROI figures in green and negative ones in red to draw the eye to the bottom-line result.
- Data Validation: Use this to create dropdown menus for key inputs like “Investment Type” (e.g., Technology, Staffing, Agency). It keeps data clean and simplifies scenario analysis.
- Clear Labels and Notes: Clearly label every input, calculation, and output. Use Excel’s “Notes” feature to add context or explain how a particular metric is derived.
In the Canadian MarTech space, projected to grow from USD 44,231.7 million in 2023 to USD 169,790.1 million by 2030, these models are proving indispensable. We worked with a Toronto-based B2B company that used a similar calculator to justify a $150,000 Salesforce Account Engagement (Pardot) customization project, forecasting a 544% ROI. They achieved 620%, generating $930,000 in new pipeline. Another client saw a 3600% ROI on email campaigns after a HubSpot migration and process optimization. For RevOps leaders, a well-built Excel calculator is the key to unlocking investment and proving your team’s strategic value.
Using Scenario Planning for Strategic Forecasting
A static ROI figure is a starting point, but its true power is unlocked when your calculator evolves from a reporting tool into a dynamic forecasting engine. A single number tells you what happened; a dynamic model shows you what could happen next. This is how you shift from looking in the rearview mirror to strategically planning the road ahead.
For anyone in RevOps, this is where you provide immense value. It transforms your return on investment calculator in Excel from a spreadsheet into a strategic weapon for your go-to-market (GTM) engineering. Suddenly, you can answer the tough, forward-looking questions that a static report cannot.
Moving Beyond Single-Point Estimates
Business is never static. Conversion rates fluctuate, sales cycles vary, and new technology constantly changes the cost structure. A single ROI calculation built on one set of assumptions is brittle; it breaks the moment reality deviates from the plan.
This is why scenario planning is crucial. By building different scenarios directly into your Excel model, you can stress-test your assumptions and analyze outcomes under various conditions. This proactive thinking demonstrates a deep understanding of the levers that drive revenue in your organization.
Leveraging Excel for Sensitivity Analysis
You don’t need complex, expensive software for this. Excel has powerful, built-in features perfect for strategic work. The two most effective are Data Tables and Scenario Manager.
- Data Tables are excellent for sensitivity analysis on one or two key variables. You can quickly see how your final ROI shifts as a single input (like lead conversion rate) or two inputs (conversion rate and average deal size) change.
- Scenario Manager allows you to save and compare entire sets of different inputs. This is ideal for more complex comparisons, such as modeling “Pessimistic,” “Realistic,” and “Optimistic” outcomes for a new campaign.
Using these tools helps build a more robust and defensible business case. Instead of presenting one number, you can show a range of potential outcomes, giving leadership a clearer picture of both the risks and the opportunities.
Practical Forecasting Scenarios for RevOps
What does this look like in practice? Let’s ground this in real-world situations. Your dynamic calculator should be able to answer specific, strategic questions that directly impact your budget and resource allocation.
Imagine you’re pitching a new MarTech investment. Instead of showing one projected ROI, you can model several possibilities:
- Technology Comparison: Model the three-year ROI of implementing HubSpot Marketing Hub Enterprise versus a Salesforce Account Engagement (Pardot) setup. Your model can account for different license fees, implementation costs, and the projected efficiency gains from each platform.
- Operational Improvement Impact: Answer the question, “What happens to our LTV:CAC ratio and overall ROI if our new lead scoring model boosts MQL-to-SQL conversion by just 5%?” This directly connects a small operational tweak to a significant financial outcome.
- Headcount Justification: Forecast the impact of hiring a new marketing operations specialist. You can model their salary against the projected gains from their work, like improved data hygiene that leads to higher sales productivity and a shorter sales cycle.
A dynamic model helps you tell a more compelling story. You’re not just requesting a budget; you’re demonstrating that you’ve rigorously evaluated multiple futures and have a clear-eyed view of how your initiatives will create value under different conditions.
This level of analysis separates a tactical operator from a strategic leader. It shows you’re not just managing systems; you’re engineering the financial outcomes of the business. By turning your calculator into a forecasting tool, you provide leadership with the data-driven confidence needed to make bold, informed decisions about your company’s growth.
Presenting ROI Findings to Your Leadership Team
You’ve done the hard work. The data is crunched, the model is built, and you’ve run the scenarios in your return on investment calculator in Excel. But raw data doesn’t persuade people; clear, strategic stories do. This is the moment to move your findings from the spreadsheet to the boardroom and secure critical executive buy-in.
The goal isn’t just to share numbers; it’s to build a clean, executive-ready dashboard that highlights bottom-line impact. Your leadership team doesn’t have time to sift through a ‘Calculations’ tab. They need to grasp the high-level takeaways instantly.

Building Your Executive Dashboard in Excel
Think of your ‘Dashboard’ tab as the one-page executive summary that tells the entire financial story. It must be visually clean, easy to scan, and focused only on the metrics that matter to the business.
To achieve this, lean on visuals that tell a story at a glance. Excel offers excellent options:
- Waterfall Charts: Ideal for showing how an initial value (your total investment) is impacted by a series of gains and losses to arrive at the final net return. It visually maps out the entire ROI journey.
- Bar Charts: Perfect for direct comparisons. Use them to show the potential ROI of different scenarios side-by-side, such as pitting a HubSpot implementation against a Salesforce Account Engagement project.
- KPI Cards: These are your headline numbers. Create large, bold cells at the top of the dashboard for the most critical metrics: the final ROI percentage, the LTV:CAC ratio, and the payback period in months.
Keep text brief. Use clear, simple titles for each chart and let the visuals do the heavy lifting. A stakeholder should be able to understand the entire dashboard in under 60 seconds.
Crafting a Narrative that Resonates
When you enter that presentation, you are a business strategist, not just a data analyst. The key is to connect every data point back to high-level company objectives. Your executives are focused on market share, profitability, and competitive advantage, not the nuances of your lead scoring model.
Frame your findings around their primary concerns.
Instead of saying, “Our new automation workflow reduced lead response time by 4 hours,” try this: “By engaging leads 4 hours faster, we boosted our MQL-to-SQL conversion rate by 15%. This model projects that will add $750,000 to our sales pipeline this year.”
The difference is clear. That shift connects an operational tweak directly to a revenue outcome. Your ROI calculator provides the evidence that makes this connection undeniable. For a deeper dive into framing these conversations, you might find more helpful strategies on how to measure marketing ROI.
Anticipating Questions and Securing Alignment
Be prepared for tough questions. Leadership will probe your assumptions, so know your numbers cold. Be ready to explain your data sources, why you chose specific variables for your scenarios, and the biggest risks involved.
Your confidence in the model will build their confidence in your proposal.
Ultimately, your goal isn’t just to present a spreadsheet; it’s to drive a decision. By turning your analysis into a clear, compelling story tied directly to business goals, you transform your ROI calculator from a simple tool into a powerful instrument for securing the resources needed to drive real growth.
Answering Your Top Questions About Building an ROI Calculator
Even with a step-by-step guide, you’re bound to encounter challenges when building a financial model from scratch. As RevOps professionals, we’ve seen certain questions arise repeatedly as our clients create their own return on investment calculators in Excel. Getting these details right is what separates a basic spreadsheet from a strategic tool that drives decisions.
The aim isn’t just to plug numbers into a formula. It’s to build a model that genuinely reflects the complex reality of B2B go-to-market motions, especially within ecosystems like Salesforce and HubSpot.
How Should I Account for “Soft” Benefits?
This is a classic question. It’s simple enough to track a $50,000 increase in pipeline, but what about benefits like improved team morale or smoother collaboration between marketing and sales? You can’t assign a random dollar value to them, but you absolutely should not ignore them.
Our recommendation: list these qualitative wins on your summary dashboard, right next to the hard numbers. The key is to frame them as the enablers of your quantifiable results.
- Better Data Hygiene: This leads directly to more reliable forecasting and prevents sales from pursuing dead-end leads.
- Improved Team Alignment: Synchronizing marketing and sales reduces friction and accelerates the lead handoff process, saving time and money.
- Enhanced Customer Experience: A smoother customer journey almost always translates into higher LTV from better retention and expansion revenue.
By connecting the dots between soft improvements and hard metrics, you paint a more compelling and honest picture of the investment’s true value.
What’s a Good Timeframe to Measure ROI?
Choosing the right timeframe is crucial; an incorrect choice can skew your entire calculation. A period that is too short—say, a single quarter—won’t capture the full impact, especially given long B2B sales cycles and technology adoption curves. A period that is too long can be muddied by too many external market factors.
For most major MarTech investments, such as a new Salesforce Account Engagement or HubSpot implementation, a three-year timeframe provides the right balance. This allows enough runway to absorb the upfront implementation costs in Year 1 and then properly model the compounding benefits as the platform becomes integral to daily operations.
How Do I Handle Attribution Complexity?
Perfect attribution is a myth. Don’t let the pursuit of it prevent a “good enough” analysis. Instead of trying to prove a single tool was 100% responsible for closing a deal (it never is), use a contribution model. Your Excel calculator can be built to assign a weighted value based on your unique GTM motion.
For instance, you could reasonably attribute 30% of a deal’s value to the marketing automation platform that nurtured the lead from MQL to SQL. This nuanced approach is far more credible when presenting to the C-suite, as it shows you understand that your GTM strategy is an interconnected system, not a collection of siloed tools.
At MarTech Do, we help B2B companies build the operational foundation to drive predictable growth. If you’re wrestling with your Salesforce or HubSpot stack and need to prove its value, we should talk. Learn how our RevOps expertise can elevate your GTM strategy.