You're thirty minutes into the Monday forecast call. The CRM says a large number will close. A manager's spreadsheet says something smaller. Marketing insists three campaigns created half the pipeline, and nobody can open an opportunity and show the touches. A revenue intelligence platform will not settle that argument by itself. It can only read the stages, owners, activity and campaign links you store.
That gap is where the true cost lies. Demos showcase model features. Incomplete lifecycle data, a score nobody can explain, and a signal that never reaches a seller are what waste the licence. The pages below cover what these platforms do, how they sit on Salesforce and HubSpot, how Canadian teams keep signals privacy-safe, which metrics prove a use case, how to score a vendor, how to build a return model, and what to fix before you buy.
What Revenue Intelligence Platforms Do
Think of a revenue intelligence platform as the instrument panel for the revenue engine. A pilot doesn't watch the engine directly. The panel brings airspeed, altitude and fuel into one picture so a decision rests on all three. Here the instruments are CRM records, email and call activity, marketing touches and product signals. A sales leader still owns the call. The panel only makes the picture shared.
Revenue intelligence platforms are software that consolidates commercial data, applies analytics and scoring, and turns the result into forecasts, alerts and next actions for sales, marketing and customer teams.

A pipeline review uses four capabilities in the same order every week.
| Capability | Question It Answers | Main Inputs | Typical Output |
|---|---|---|---|
| Pipeline analytics | Where is pipeline stalling and how fast does it move? | Opportunity stages, stage history, close dates | Stage conversion, velocity and coverage reports |
| Deal signals | Which open deals are gaining or losing momentum? | Emails, meetings, calls, champion activity | Risk and momentum flags on each opportunity |
| Forecasting | How much will close this quarter, and how confident are we? | Rep commit, historical win rates, deal signals | Weighted forecast with confidence ranges |
| Attribution | Which activities and campaigns created or accelerated pipeline? | Campaign touches, lead source, opportunity links | Influenced pipeline by channel and campaign |
A report versus a next action
A standard CRM report shows what already happened: stage, amount, close date, owner. The platform adds signals and routes a next action. Say an opportunity has sat in negotiation for 21 days, the champion hasn't replied in ten, and the close date moved once. Pipeline analytics marks the stall. Deal signals flag the silence. Forecasting lowers the weight. Attribution still credits the campaign that opened the account, so marketing doesn't lose the history when sales rewrites the source.
Adoption context matters because these tools assume a working commercial system. Statistics Canada reported that, in 2023, 7% of Canadian businesses with five or more employees used AI, and 26% of large businesses did so compared with 6% of small businesses. Larger firms are further along because their stages, owners and activity capture are more standardised. A small team can still use the category. It can't skip that foundation.
The platform can only read the data it receives. Without accurate stages, owners and close dates, every capability produces confident but wrong output.
Start with the records. The model comes later.
Data Sources and Integration With Salesforce and HubSpot
Four source groups feed the panel, and each one has a job.
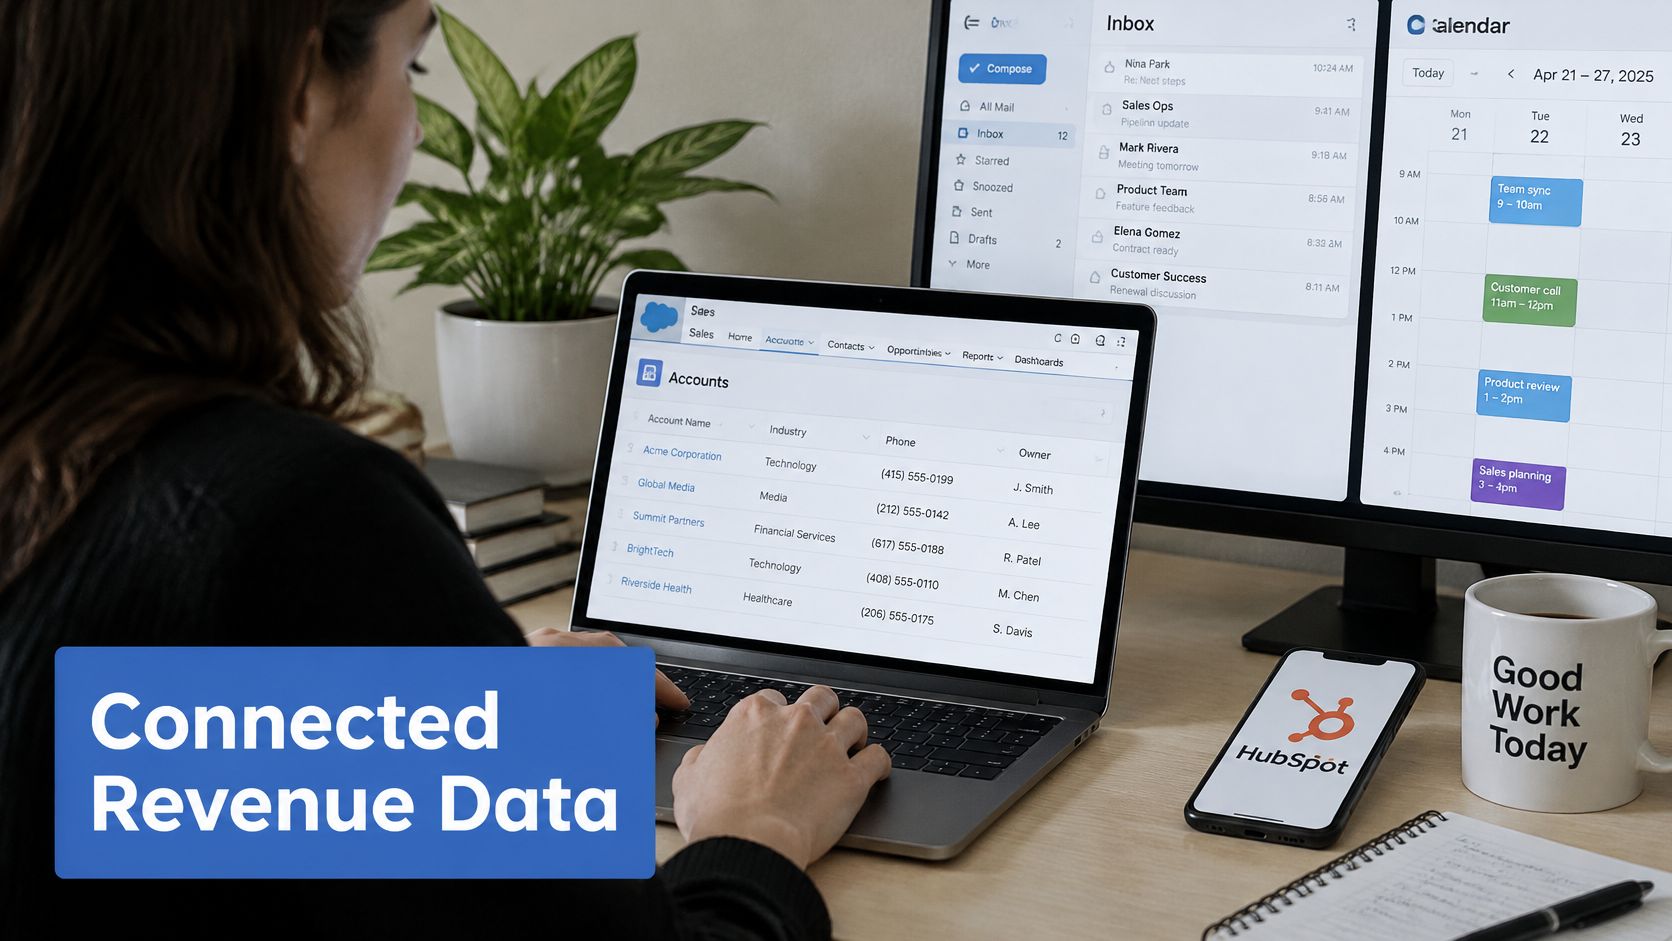
The CRM is the system of record for accounts, contacts and opportunities. Salesforce Sales Cloud or HubSpot Sales Hub anchors every other feed. Marketing automation adds engagement, form fills, campaign membership and lead source through Account Engagement (fka Pardot) or HubSpot Marketing Hub. Product usage shows adoption and expansion, such as active users and feature events on an existing account. Finance supplies booked revenue, contract value and renewal dates so open pipeline can be compared with what was invoiced.
National CRM use is still modest. Fluid CRM's summary of Statistics Canada figures puts private-sector CRM software use at 17.4% in 2023, up from 16.4% in 2019. Many Canadian companies still run pipeline in spreadsheets and informal handoffs. If that is you, connect the CRM first and treat the intelligence layer as a later step.
Four ways to connect, and what you give up
Native connectors sync standard objects quickly, and you give up control over custom fields and sync timing. API integrations handle custom objects and events, and you spend more build time to keep latency and field lists explicit. Warehouse sync joins every source in one store before the platform reads it, which is slower to stand up and cleaner when finance, product and CRM disagree. Middleware reaches older systems, and every extra hop is another place a value can change without an owner noticing.
Two more inputs belong on existing-customer work. Service Cloud case volume and escalation status show whether an account is healthy enough to expand. Revenue Cloud quote data links open pipeline to contracted revenue, so a forecast isn't only a sales commit.
| Source | Role in Revenue Intelligence | Common Integration Pattern | Key Fields to Map |
|---|---|---|---|
| Salesforce Sales Cloud or HubSpot Sales Hub | System of record for accounts, contacts and opportunities | Native connector or API sync | Account ID, opportunity stage, close date, owner |
| Account Engagement (fka Pardot) or HubSpot Marketing Hub | Engagement, form and campaign signals | Native connector or sync through CRM objects | Lead source, campaign member status, score |
| Product usage data | Adoption and expansion signals | Warehouse sync or event API | Account ID, active users, feature events |
| Finance and billing systems | Booked revenue, contract and renewal dates | Scheduled export or ERP connector | Contract value, term end, invoice status |
One ID, one owner, one winner
Map one account ID across systems. Give lifecycle stage a single owner, usually the CRM. Write a conflict rule before the first sync: if marketing and sales both store a stage, the CRM value wins and the other system stops writing it. List every field the platform will read and name its system of record before you connect anything. A practical shortlist of connectors lives in our guide to data integration tools for RevOps stacks.
Privacy-Safe Signals for Canadian GTM Teams
Classify every field the platform will read. Keep a field only when a named signal needs it. A momentum flag needs meeting dates and reply recency. It doesn't need a home address, a full call transcript, or a free-text note about someone's family.
Name a privacy owner for the go-to-market stack and record who approves each new data source. The Office of the Privacy Commissioner of Canada says organisations using AI must set governance roles, limit personal information to what is necessary, use de-identified data where possible, and make AI use transparent and explainable. On that same research, business AI use rose from 6% in 2023 to 16% in 2025, 72% of businesses reported a designated privacy officer, and 13.4% named cybersecurity or privacy concerns as a barrier to AI use. Governance is an adoption constraint, not a footnote.
Limit collection to the signal. Use account-level engagement counts and stage history. Leave personal detail out of transcripts and notes unless a defined use requires it. Build and back-test models on de-identified records when the forecast allows it, and keep personal data in the CRM under field-level security. Each score should state its inputs so a rep can see why a deal is flagged. Log which fields feed each model and review the log quarterly. Consent, notice and vendor questions belong in a written consent management framework before any feed is switched on.
If a signal can't be explained or traced to a permitted source, leave it out of the forecast.
GTM and RevOps Use Cases and the Metrics They Move
A platform earns its place when a named person acts and a metric moves. Five situations cover most B2B teams. A clear view of revenue operations for B2B teams helps you assign those owners before the first alert fires.
Deal inspection before the forecast call. On Thursday, a manager opens only the deals with no next step, or with a close date pushed twice this quarter. The metric is stage conversion, not the number of flags. If inspected deals move forward more often than untouched ones, the review is working.
Routing. An inbound lead from a named territory hits the right rep, and you measure speed-to-lead in minutes against a service-level target. Minutes, not “same day.” A lead that waits four hours is a different process from one that waits fifteen.
Expansion and renewal. Customer success sees an account whose active users jumped, or whose contract ends inside 120 days. Judge it on net revenue retention and on whether the alert was worked before the renewal conversation, not on how many alerts fired.
Campaign review. Marketing operations compares pipeline influenced by each channel, not only leads created. A webinar that creates few leads and a large share of influenced pipeline is a different decision from a form that creates many leads and little pipeline.
Forecast accuracy. Sales leadership tracks the gap between the call and closed revenue. Set the tolerance with them. Within 10% of actual by the final month is a starting point you choose, not an industry benchmark.
How to tell a process from a dashboard
Compare a treated group of reps or accounts with a control group. Judge conversion rate, speed-to-lead, stage progression and pipeline created. Ignore activity volume. Among Canadian businesses planning to adopt AI in the following 12 months, Statistics Canada found 32.9% intended to use data analytics, 28.5% text analytics and 25.6% marketing automation. Those three only change seller behaviour when a scored signal carries a source, a timestamp, a confidence level, decay logic and an action owner. A high-confidence engagement spike should open an account review only when the account is open, assigned and inside the territory. Otherwise suppress or reroute it.
A use case without a named owner and a metric is a dashboard, not a process.
How to Evaluate Platforms Against Your Stack
A failed write-back wastes more budget than a weak score. Start your test with the Salesforce or HubSpot org you already run and check six things in order.
CRM depth comes first. The platform should read and write standard and custom objects using your real stage names, not show a copy in a side panel. Signal explainability is next. Every score needs a source, a timestamp, a confidence level and a decay rule for old activity. Then run a forecast back-test. Ask the vendor to rerun your last four quarters of closed deals and compare predicted and actual results on your data, not a sample tenant.
Automation control splits in two. Rules-based routing and alerts need audit logs and an easy reversal. AI-driven actions need a human approval step before they touch the record. Governance covers field-level permissions, retention, deletion on request and where data is processed. Admin effort is the hours per month your team will spend on mappings and models without a vendor on the call.
Automation is wider than AI, as Statistics Canada data on adoption shows. Put routing rules, SLA timers, lifecycle updates and sync jobs in place with explicit conditions and logs. Add a score only when it has its own review path. That order closes the gap between a signal firing and a seller acting on it, which is where most pilots lose value.
A 30-day pilot you can score
Run 30 days with one team on historic and live deals. Score each criterion pass or fail. Do not average them into a soft middle. One fail on write-back or on retention is enough to stop.
| Criterion | What to Test | Red Flag |
|---|---|---|
| CRM depth | Native read and write on Salesforce and HubSpot objects, including custom stages | Sync only reads, with no write-back |
| Signal explainability | Each score shows source, timestamp and confidence | Black-box score with no stated reasons |
| Forecast back-test | Accuracy against the last four quarters of closed deals | Accuracy cannot be verified or is vendor-reported only |
| Automation control | Rules-based routing and alerts with audit logs | AI actions that cannot be audited or reversed |
| Data governance | Field-level permissions, retention settings, deletion on request | No retention controls or unclear data processing location |
| Admin effort | Hours per month to maintain mappings and models | Every field change needs vendor services |
Use the scorecard in the demo, not after the contract. If the vendor cannot run the back-test on your closed deals, you do not have a forecast product yet.
Building an ROI Model With a Worked Example
Annual value equals added revenue from faster, better-prioritised follow-up, plus capacity from rep time saved, minus the total annual cost of the platform, implementation and admin. Measure the baseline. Assume the lift only where you label it as an assumption.

Take a mid-market team that receives 400 inbound leads a month, 4,800 a year. Lead-to-opportunity conversion rises from 2.0% to 2.4% after speed-to-lead drops from four hours to fifteen minutes. That adds 1.6 opportunities a month, or 19.2 a year. At a 25% win rate and an average deal of $25,000, you get 4.8 extra deals and $120,000 in added revenue. Six reps each save three hours a week across 48 working weeks. At a loaded cost of $45 an hour, the gross saving is $38,880. Count half, $19,440, so you don't treat every freed hour as sold time.
Licence fees are $60,000 a year. Implementation is $25,000, spread over three years, about $8,333 a year. Annual cost is about $68,333. Net annual value is roughly $71,000 ($120,000 plus $19,440, minus $68,333).
| Line item | Value |
|---|---|
| Inbound leads per year | 4,800 |
| Added opportunities per year | 19.2 |
| Added deals at 25% win rate | 4.8 |
| Rep time saved | $19,440 (50% of $38,880) |
| Annual licence fees | $60,000 |
| Implementation over three years | $25,000 |
| Annual cost | $68,333 |
| Net annual value | about $71,000 |
Leads, current conversion, win rate, deal size, hours and costs should be measured. The 0.4-point conversion lift is an assumption until the pilot proves it. After time savings, $48,893 of cost remains. Net value hits zero when added revenue covers that amount, about 7.8 extra opportunities a year, or a conversion lift of roughly 0.16 points (2.0% to 2.16%). Revenue is an upper bound. Rerun the check on gross margin, which raises the break-even, and report both figures. Vary conversion lift and win rate in a two-way grid so you can see where the case still holds. Our walkthrough of the payback period calculation shows how to turn that net figure into months.
A model is only as credible as its baseline. Capture three months of baseline data before the rollout starts.
Readiness Audit and Rollout Checklist
Score the data before you shortlist a vendor. Check required-field completeness in the CRM, duplicate rate on accounts and contacts, stage-history availability, contact-to-account matching, and routing SLA adherence. Cleanlist notes that business data degrades by roughly 2–3% a month, so treat this audit as a recurring check, not a one-time cleanup before go-live.
Canadian use is still early. Statistics Canada found that 12.2% of firms used AI to produce goods or services in 2025 and 14.5% planned to adopt it within 12 months, yet only 8% reported using AI significantly in core operations while 50% reported low or moderate use. Data analytics (36.6%) and text analytics (34.5%) were the most common applications. If the scorecard fails on data, fix the foundation before you purchase. Shortlist two platforms and run that scorecard on a live sample of your deals, not the vendor demo tenant.
A revenue intelligence tool works like a smoke detector. It only helps when the wiring is sound and someone responds to the sound. Most failed rollouts come from that middle gap. The signal fires, but no seller acts because ownership, timing, or next steps were never defined.
Six steps after you buy
- Confirm the foundation. Rescore completeness, duplicates and stage history. Scoring dirty data yields confident, wrong output.
- Define each signal. Give it a source, an owner and a decay rule. Alerts with no owner get ignored.
- Assign one writer. One system owns lifecycle stage and account ID. Two tools writing stage will flip values overnight.
- Pilot for 30 days and back-test. Do not go company-wide before accuracy is proven on your closed deals.
- Switch on rules first. Routing and alerts with logs come before any AI score. Predictions on a broken process just fail faster.
- Review monthly. Watch alert volume, the share acted on, and forecast error. Flag signs of alert fatigue in that review, such as falling open rates and slower follow-up.
Allow 60 minutes of onboarding per workflow. Skipped training is a common reason rollouts stall.
Copy this list and date it: data audit complete, signal owners named, field ownership signed off, pilot metrics agreed, review cadence booked. The RevOps System Audit is best for teams that need clarity before making major system, process, or platform changes. The review covers the CRM, automation, lifecycle and data quality, then provides a practical roadmap, and helps you choose among Salesforce, Account Engagement (fka Pardot), HubSpot and Clay and tailors the fit.
MarTech Do designs and optimises the Salesforce and HubSpot systems behind marketing, sales and customer lifecycle performance, including the data, routing and reporting a revenue intelligence platform depends on. If your forecast call still rests on conflicting spreadsheets, we can audit the foundation and map a practical rollout before you add another tool. Visit MarTech Do to talk through a RevOps System Audit for your stack.