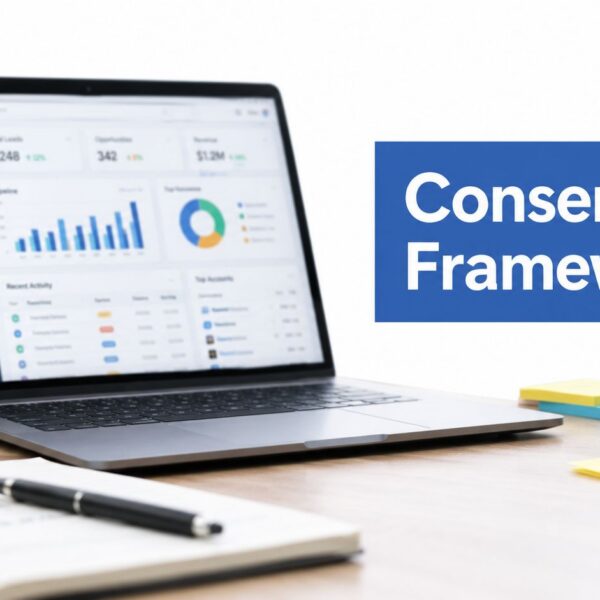

Your Salesforce data is a goldmine, yet your weekly reports still feel like a dead end. Sales says the pipeline report is wrong. Marketing says attribution is incomplete. Leadership wants one forecast number, and every team brings a different version into the meeting. The problem usually isn’t a lack of dashboards. It’s a mismatch between the way your GTM team operates and the reporting layer you’ve put on top of Salesforce.
I see this constantly in B2B environments running Sales Cloud, Service Cloud, Account Engagement, Revenue Cloud, and HubSpot alongside Salesforce. Teams buy another dashboard tool before they fix metric definitions, security logic, campaign structure, or data movement. Then they wonder why reporting still feels slow, political, or unreliable. If you also need to streamline ad spend with Salesforce integration, the reporting conversation gets even more operational because spend, pipeline, and attribution have to line up.
The good news is that the current market for Salesforce reporting tools is strong. The bad news is that the wrong choice can create more admin overhead than insight. Native reports might be enough. CRM Analytics might be the right middle ground. Or you may need a warehouse-first BI stack because your GTM motion spans Salesforce, HubSpot, product data, support, enrichment, and outbound systems like Clay and ZoomInfo.
This guide keeps the list practical. No fluff, no generic “best tool” claims. Just what each option does well, where it breaks, and who should own it.
1. Salesforce Reports & Dashboards

A sales manager is ten minutes from forecast call, wants pipeline by stage, slipped deals, and next-step coverage by rep, and does not want to leave Salesforce to get it. That is the job native Reports & Dashboards handle best.
For B2B RevOps teams, this is usually the first reporting layer to fix before buying anything else. If sellers, managers, and service leads already work in Salesforce all day, native reporting gives them fast access to operational metrics inside the same system where records are updated, workflows fire, and security is already defined.
Salesforce’s native reporting supports tabular, summary, matrix, and joined formats, plus custom report types for object relationships. In practice, that provides sufficient scope for forecast inspection, lead follow-up reporting, case queue monitoring, and activity visibility without needing another BI tool. You can go deeper on reports in Salesforce if you’re cleaning up a native reporting setup that already exists but isn’t trusted.
Where native reporting earns its place
Native reports work best when the question maps closely to the CRM data model and someone needs the answer during execution, not after an analyst exports data.
- Pipeline inspection: Opportunities by stage, age, amount, close date, source, and owner.
- Manager accountability: Calls, meetings, tasks, conversion rates, and rep pacing against target.
- Service operations: Cases by queue, status, priority, and SLA-related workflow views.
- Access control: Folder permissions and row-level visibility follow Salesforce sharing and role hierarchy.
My rule is simple. If a frontline manager needs the metric in the same screen where they coach reps or update records, keep it native until a real reporting constraint forces a change.
That said, native reporting has limits, and they show up quickly in multi-system GTM environments. Historical trend logic can get messy. Cross-object reporting often depends on careful report type design. Attribution reporting breaks down if campaign structure is inconsistent. Once a company needs Salesforce data blended with HubSpot, product usage, finance, support, and outbound signals, the reporting model starts stretching beyond what native dashboards handle comfortably. Teams planning a unified RevOps dashboard architecture across HubSpot and Salesforce usually keep Salesforce dashboards for execution and move cross-functional analysis into a broader analytics layer.
There is also an ownership trade-off. Native reporting is often inexpensive to start, but it can become admin-heavy if every leader asks for a slightly different dashboard, filter set, and field logic. I have seen teams create dozens of near-duplicate reports because metric definitions were never standardized. The tool was not the primary problem. Governance was.
Salesforce reports also got much easier to use after Lightning became the primary experience, especially for dashboard consumption and report building. If users still say native reporting feels clunky, check page layouts, report folder sprawl, field naming, and mobile usability before assuming you need a new platform.
For admin efficiency, some teams also pair native dashboards with workflow improvements that resolve timesheet fatigue in Salesforce, especially when activity capture and rep adoption are part of the reporting problem.
Website: Salesforce
2. Salesforce CRM Analytics

A familiar RevOps pattern looks like this. Leadership wants pipeline by segment, forecast by rep, campaign influence, renewal risk, and board-ready dashboards in one place. Native Salesforce reporting can cover part of that, but once teams start asking for joined data, row-level security across functions, and guided analytics inside the CRM, CRM Analytics usually enters the conversation.
CRM Analytics fits B2B teams that want a stronger analytics layer without forcing sellers and managers out of Salesforce. It gives RevOps more control over data prep, metric logic, dashboard design, and how insights get delivered in the workflow. That last point matters. Adoption is usually better when managers can review performance in the same system where reps update pipeline.
Best fit for RevOps architecture
I usually see CRM Analytics work well in three situations:
- Cross-functional GTM reporting: Sales, marketing, customer success, and finance need shared views with tighter metric control.
- In-workflow dashboards: Teams want analytics embedded in Lightning pages instead of sending users to a separate BI tool.
- Advanced pipeline and forecast analysis: RevOps needs more than static reports, especially for trend analysis, cohort views, and predictive scoring.
For organisations designing a unified RevOps dashboard architecture for HubSpot and Salesforce, CRM Analytics often sits between native CRM reporting and a broader BI stack. It is a practical middle layer when the GTM team still operates heavily in Salesforce but reporting needs have outgrown standard dashboards. If executive reporting later needs more presentation flexibility, it also helps to review examples of Tableau dashboards for leadership reporting and decide where CRM Analytics should stop.
The trade-off is straightforward. CRM Analytics keeps governance, permissions, and user experience close to Salesforce, which makes rollout easier for many B2B teams. It also adds another layer to design and maintain. Dataflows, recipes, dataset performance, app ownership, and release management all need clear ownership. Without that discipline, teams end up with attractive dashboards built on inconsistent logic.
Predictive features can help, but they do not fix weak process. Forecast models still depend on clean opportunity data, consistent stage definitions, and rep behavior you can trust. I have seen teams buy CRM Analytics expecting better forecasts, then discover the underlying problem was inspection hygiene and field governance. In that case, the platform is useful, but the operating model needs attention first.
Website: Salesforce CRM Analytics
3. Tableau

Tableau is the tool executives often ask for by name. Usually that’s because they’ve seen a polished board dashboard somewhere else and want the same level of visual flexibility. In many cases, that’s a fair ask. Tableau is still one of the strongest options for rich data visualisation across Salesforce and non-Salesforce sources.
It’s especially useful when RevOps has already centralised data outside the CRM and needs a presentation layer that can handle more nuanced storytelling than native Salesforce dashboards. The visual language is strong. The ecosystem is mature. And if your analytics team already works in Tableau, adoption friction is lower.
What works well
Tableau is a strong fit when you need:
- Executive dashboards: Cleaner multi-source visual design than most embedded CRM tools.
- Warehouse analytics: Better support for broader enterprise data models.
- Flexible deployment: Cloud or Server, depending on your environment and governance needs.
You can see examples of that style in these Tableau dashboard examples, particularly if your reporting audience includes leadership and cross-functional planning teams rather than only sales managers.
Where Tableau gets tricky in Salesforce reporting projects is data access design. Too many teams assume they can point Tableau at Salesforce and call it done. In practice, connector choices, refresh strategy, extract logic, and security alignment need attention. If you skip that work, dashboards look good but trust erodes fast.
The visual layer rarely causes reporting failure. Metric definition, source-of-truth decisions, and refresh logic do.
I like Tableau when a business has moved beyond pure CRM operations and wants a proper BI practice. I don’t like it when the core issue is sloppy Salesforce architecture. Tableau won’t fix bad opportunity hygiene, inconsistent campaign member strategy, or broken lifecycle stages. It will only make those problems easier to see.
Website: Tableau
4. Microsoft Power BI

Power BI is usually the practical choice when the rest of your business already runs on Microsoft. If finance lives in Excel, IT governs Azure, and your broader data strategy points toward Fabric or a Microsoft-centric warehouse stack, Power BI often gives RevOps the least resistance path.
Its strength isn’t that it’s “better than Salesforce” at everything. It’s that it plugs into an existing enterprise standard. For many B2B teams, that matters more than feature-by-feature comparisons.
Where it fits best
Power BI tends to work well for:
- Cross-functional reporting: Sales, marketing, customer success, and finance in one semantic model.
- Microsoft-heavy estates: Easier stakeholder alignment when procurement and IT already support the platform.
- Distribution flexibility: Per-user and capacity-style approaches can support different rollout models.
The trade-off is implementation discipline. Salesforce connectors are useful, but serious RevOps teams often stage Salesforce data before modelling. That’s not because Power BI is weak. It’s because direct CRM extraction becomes messy once you need historical logic, clean dimensional modelling, and blended GTM metrics across systems.
I’ve seen Power BI become a very good RevOps reporting layer when operations, analytics, and IT agree upfront on ownership. I’ve also seen it become a reporting landfill where every department publishes its own pipeline definition. The tool doesn’t decide that. Governance does.
If your GTM team wants one view across Salesforce, HubSpot, support data, spend, and downstream revenue, Power BI can absolutely do the job. Just don’t treat the Salesforce connector as a substitute for data architecture.
Website: Microsoft Power BI
5. Looker

Looker is for teams that are tired of arguing about definitions. If pipeline, sourced revenue, influenced revenue, lifecycle conversion, and forecast categories all mean different things in different dashboards, Looker’s semantic layer becomes very attractive.
That’s the core value of LookML. It forces decisions. RevOps defines the KPI once, publishes the logic, and stops recreating the same metric in five tools.
Strong governance, heavier setup
Looker works best when your organisation wants a central analytics model for GTM, not just a dashboard builder.
- Metric governance: Shared business logic across sales, marketing, and leadership.
- Embedding: Strong if you want analytics inside portals or internal applications.
- Warehouse-first strategy: Best when Salesforce is one source among many.
The downside is obvious. You need modelling skill. Teams that don’t have analytics engineering capability often buy Looker for governance and then recreate spreadsheet chaos in a more expensive environment.
Looker is a smart fit for larger B2B companies with a proper data team and a serious need for a single source of truth. It’s overkill for a company that just needs cleaner Salesforce forecast dashboards. If your reporting pain is mostly inside the CRM, solve that first. If your pain comes from fragmented GTM data across systems, Looker becomes much more compelling.
Website: Looker
6. Domo

Domo sits in an interesting middle ground. It isn’t just a dashboard tool, and it isn’t purely a classic BI stack either. For RevOps, that can be useful when you want one platform that handles integration, visualisation, app-style workflows, and some writeback patterns around Salesforce.
That’s why Domo often shows up in projects where the team needs cross-system GTM scorecards quickly but doesn’t want to assemble a full warehouse-plus-BI stack on day one.
Practical trade-offs
Domo is a good option when you need:
- Salesforce connectivity plus action: Import and writeback patterns can support operational workflows.
- Broad distribution: Dashboards and apps can be shared beyond the analyst team.
- One-platform convenience: Data movement and reporting in one environment.
The trade-off is that “all-in-one” platforms still need architecture. If you don’t design ownership, dataset governance, and app lifecycle properly, Domo can sprawl just like any other analytics platform.
Operator’s note: Domo is attractive when the business wants speed and visible outputs fast. It’s less attractive when procurement expects simple packaging and a tiny implementation footprint.
I’d consider Domo for mid-market and enterprise teams that need business-facing analytics plus operational apps, especially when Salesforce is central but not the only reporting domain. I wouldn’t choose it just to replace standard Salesforce dashboards.
Website: Domo
7. ThoughtSpot

ThoughtSpot is a good answer to a specific problem. Business users want to ask direct questions about pipeline, coverage, conversion, or activity trends without waiting for an analyst to build a new dashboard.
That search-first experience is where ThoughtSpot stands out. It’s useful for self-serve teams that don’t want to learn a traditional BI workflow just to explore a number.
Best for question-driven analytics
ThoughtSpot tends to work well when:
- Non-analysts need access: Sales leaders and GTM managers can explore without deep BI training.
- You already have a warehouse: The model underneath matters a lot.
- Embedding matters: External analytics or partner-facing views are part of the plan.
The caution is important. Search-driven analytics still depends on clean modelling. If your Salesforce data is inconsistent or your warehouse layer is poorly designed, ThoughtSpot won’t save you. Natural language interfaces are only as trustworthy as the logic beneath them.
I like ThoughtSpot when the business has already invested in data foundations and now wants broader access. I don’t like it as a shortcut around RevOps governance.
Website: ThoughtSpot
8. Sigma Computing

Sigma is one of the easiest tools to hand to an operations analyst who thinks in spreadsheets but needs warehouse-grade reporting. That combination is powerful. A lot of RevOps work still happens in sheets because teams need flexibility fast. Sigma preserves that working style without forcing people back into CSV chaos.
For Salesforce reporting, Sigma makes the most sense when your team already stages CRM data into Snowflake, BigQuery, Databricks, or a similar warehouse.
Why RevOps teams like it
Sigma is strong for:
- Spreadsheet-style analysis: Familiar authoring for operations and business analysts.
- Live warehouse querying: Good when your source of truth is no longer the CRM alone.
- Operational outputs: Paginated reports, exports, and distributed reporting can be useful.
The constraint is straightforward. Sigma is not the tool I’d choose if your plan is to live directly on Salesforce with minimal data engineering. It assumes a more modern data stack. If that stack exists, Sigma can be productive very quickly. If it doesn’t, implementation becomes more about plumbing than reporting.
For growing B2B companies building a warehouse-backed RevOps model, Sigma is often more approachable than classic BI for the people who own the reporting backlog.
Website: Sigma Computing
9. Qlik Cloud Analytics

Qlik has always appealed to teams that want fast exploratory analysis. Its associative approach can be useful when RevOps needs to slice Salesforce data against other sources without forcing every question into a rigid dashboard path.
That matters in messy GTM environments. Sometimes you don’t need another polished KPI page. You need to explore why conversion dipped in one segment, why one region’s sales cycle shifted, or which campaign cohort behaves differently after handoff.
Where Qlik is useful
Qlik is worth considering if you need:
- Exploration-heavy analysis: Strong for analysts and power users who ask lots of follow-up questions.
- Hybrid deployment options: Helpful in organisations with mixed governance requirements.
- Governed app publishing: Useful once exploratory work becomes standard reporting.
The trade-off is planning. Qlik’s packaging and deployment choices can take more effort to evaluate than more familiar mainstream options. Some teams love that flexibility. Others experience it as decision fatigue early in the project.
Qlik isn’t usually the first recommendation for a straightforward Salesforce reporting need. It becomes more interesting when your analytics culture values exploration and your reporting scope extends well beyond CRM.
Website: Qlik
10. Klipfolio
Klipfolio is the practical lightweight option on this list. If you need executive snapshots, scorecards, client-facing views, or quick GTM dashboards across Salesforce and HubSpot, it can get useful outputs live faster than heavier BI platforms.
That’s why agencies, consultancies, and lean RevOps teams often like it. You don’t need a full analytics engineering programme to put common metrics in front of stakeholders.
Fast start, lower ceiling
Klipfolio is a sensible choice when:
- Speed matters: You need dashboards up quickly.
- Multi-tool GTM visibility matters: Salesforce plus HubSpot is a common pattern.
- External reporting matters: Sharing polished views with clients or business leaders is part of the job.
It does have a ceiling. Once your organisation needs tighter semantic governance, deep transformation logic, or more advanced enterprise analytics workflows, Klipfolio can start to feel narrow.
One more reason this matters in current Salesforce reporting discussions is the mobile gap. A CA-specific GTM Engineering survey cited in this mobile reporting discussion says 78% of California sales reps primarily use mobile devices for daily CRM access, while only 12% of current Salesforce reporting guides include mobile-specific best practices. If your field teams rely on phones, don’t only judge tools by how dashboards look on a desktop. Native Salesforce mobile consumption, simplified KPI layouts, and mobile filter behaviour should be part of selection.
Website: Klipfolio
Top 10 Salesforce Reporting Tools, Feature & Performance Comparison
| Tool | Core focus / key features | Target audience / primary use case | Strengths / unique selling points | Considerations / pricing notes |
|---|---|---|---|---|
| Salesforce Reports & Dashboards (native) | Lightning Report Builder, dashboards, folder sharing, row‑level formulas | Sellers & managers; operational CRM reporting inside Salesforce | Native to CRM, honors SF security, no extra platform | Included with SF editions; limited for complex cross‑object analytics and org‑level limits |
| Salesforce CRM Analytics (Tableau CRM / Einstein) | Analytics Studio, templated Sales/Service apps, Einstein Discovery (ML) | Predictive analytics and blended SF + external data for embedded insights | Native embedding, governed distribution, built‑in ML (Plus) | Viewer/licensing can scale cost; higher admin/implementation complexity |
| Tableau (from Salesforce) | Interactive dashboards, rich viz, SF connectors, embed options | Executive dashboards and cross‑system BI from warehouse + SF data | Mature visualization, flexible deployment (Cloud/Server), large ecosystem | Often uses extracts from SF; costs scale by role/edition and AI bundles |
| Microsoft Power BI | Semantic modeling, native SF connectors, Microsoft ecosystem integration | Organizations standardized on Microsoft 365 / Azure / Fabric | Attractive TCO for MS shops, flexible distribution (per‑user or capacity) | SF connectors have API/model limits; best with staged warehouse for performance |
| Looker (Google Cloud) | Governed semantic layer (LookML), embedding, central metric definitions | Centralized KPI governance across SF and data warehouse | Strong metric governance, enterprise embedding/extensibility | Quote‑based pricing; requires LookML modeling expertise |
| Domo | End‑to‑end: connectors, ETL, writeback, AppStudio and embedding | Operational GTM apps and cross‑system scorecards; SF writeback use cases | Full stack (integration→viz→apps), proven SF integration patterns | Complex packaging and pricing; significant implementation effort for governance |
| ThoughtSpot | AI/search analytics, natural language querying, Liveboards, embedding | Self‑serve KPI exploration for non‑analysts; partner/customer analytics | Fast, search‑driven insights; strong embedding for external use | Typically relies on modeled warehouse layer; custom/quote pricing |
| Sigma Computing | Warehouse‑native BI, spreadsheet‑style UI, pixel‑perfect exports | RevOps analysts who prefer spreadsheet authoring on governed warehouse data | Familiar spreadsheet authoring, live warehouse queries, report bursting | Designed for modern DWs (Snowflake/BigQuery/Databricks); SF live use needs staging |
| Qlik Cloud Analytics (Qlik Sense) | Associative engine, in‑memory analysis, capacity tiers | Fast exploratory analysis over blended SF and non‑CRM data | Powerful associative exploration, hybrid deployment options | Pricing/tiers can be hard to estimate; feature parity varies by deployment |
| Klipfolio (PowerMetrics / Klips) | Lightweight dashboards, turnkey connectors, templates, scheduled snapshots | Fast GTM scorecards, exec snapshots, agencies managing multiple clients | Low cost of entry, quick setup, partner/agency features for multi‑client dashboards | Limited advanced modeling/semantic layer; may be outgrown by complex needs |
From Data to Decisions Activating Your Reporting Strategy
A RevOps leader sees this pattern all the time. Forecast calls run long, marketing and sales bring different numbers, and the dashboard everyone screenshots for the board still depends on manual cleanup in a spreadsheet. The reporting problem usually is not a lack of charts. It is a lack of agreement about what the business is measuring and where those numbers should live.
The right Salesforce reporting tool is the one your GTM team will trust enough to use in weekly decisions. In practice, that means matching the tool to the job. Native Salesforce Reports and Dashboards fit frontline inspection, manager accountability, and rep-level action inside the CRM. They are often the fastest way to get a sales org using data consistently, especially when the team needs answers during pipeline review, forecast submission, or territory check-ins.
For marketing and sales alignment, the primary question is not which dashboard looks better. It is whether your model reflects how demand is created. Salesforce Campaign Influence can help teams connect campaigns to opportunity outcomes, but only if campaign structure, member status logic, and opportunity association are clean. I have seen teams buy a more advanced BI layer before fixing those basics. They ended up with better visuals and the same attribution argument.
The same trade-off shows up in Account Engagement environments. Salesforce’s B2B Marketing Analytics documentation explains the setup requirements clearly. CRM Analytics setup, data sync, and connections need to be in place before the app is useful. That sounds procedural, but it affects time to value. If the connector plan is weak, the project stalls before stakeholders ever see a usable dashboard.
Teams with a warehouse strategy usually need a different reporting layer. Tableau, Power BI, Looker, Sigma, Qlik, Domo, and ThoughtSpot all make sense in the right environment, but the deciding factor is rarely a feature checklist. It is operating model fit. Who owns metric definitions? Who maintains transformations? Who approves access by region or business unit? Who updates dashboards after a sales process change or a lifecycle redesign? Those questions decide whether the tool becomes part of your GTM system or another reporting silo.
Mature RevOps teams distinguish between reporting and dashboard production. Reporting is a management system. Dashboard production is the output.
Start with the pieces that create trust. Define the KPI dictionary. Audit object usage and field hygiene. Standardize lifecycle stages across sales and marketing. Fix campaign naming and status governance. Decide whether Salesforce is your source of truth, your system of action, or both. If you are comparing broader BI options beyond the Salesforce stack, this guide for BI tool selection is a useful companion read.
At MarTech Do, this is usually the turning point in the engagement. Once the data model, governance rules, and GTM ownership are clear, tool selection gets easier and adoption improves. Good reporting does not just describe performance. It gives sales, marketing, and customer teams a shared version of reality they can act on.
If your Salesforce reporting still depends on manual exports, conflicting definitions, or dashboards nobody trusts, MarTech Do can help you fix the root issue. The team audits your CRM and marketing operations stack, redesigns reporting architecture around how your GTM motion operates, and implements dashboards, attribution, integrations, and RevOps processes your team can maintain after go-live.