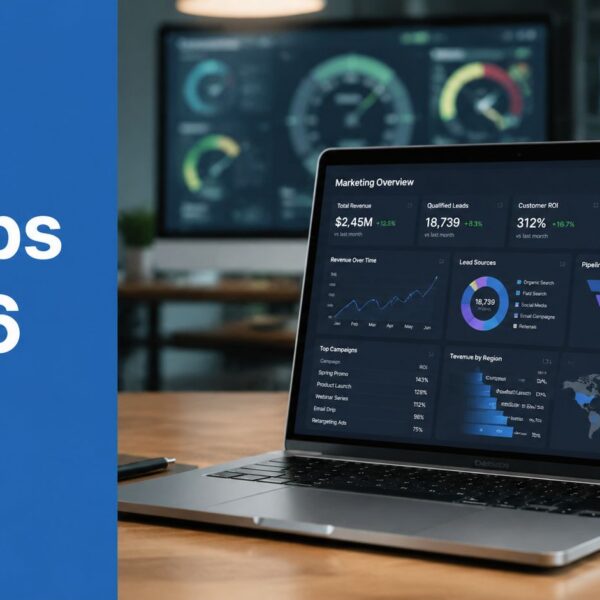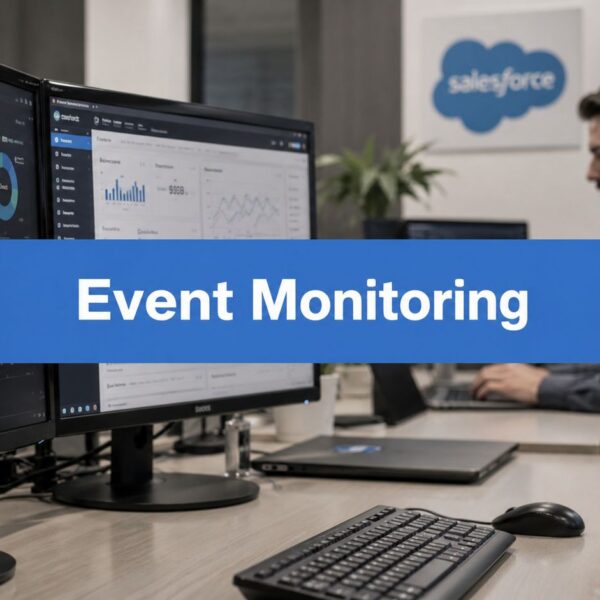
You’re probably dealing with a familiar pattern. Marketing reports one funnel number from HubSpot. Sales reports a different pipeline number from Salesforce. Finance has a third number in a spreadsheet or BI tool. The meeting stops being about revenue performance and turns into a debate about whose report is “right”.
That’s the moment when a dashboard project stops being a reporting request and becomes an architecture decision.
If you’re evaluating revenue operations providers, the core question isn’t whether they can build charts. It’s whether they can design a unified revops dashboard architecture for hubspot salesforce that gives your teams one trusted operating model for pipeline, conversion, forecasting, and attribution. The providers worth hiring won’t start with visualisations. They’ll start with your data model, metric definitions, sync design, governance rules, and adoption plan.
The Strategic Case for a Single Source of Truth
Conflicting reports usually aren’t a dashboard problem. They’re a systems design problem. When HubSpot and Salesforce carry different stage definitions, field histories, ownership rules, or sync timing, every dashboard inherits that conflict.
A single source of truth fixes more than reporting friction. It changes how leaders run the business. Sales can trust marketing-sourced pipeline views. Marketing can trace lifecycle progression without rebuilding spreadsheets. Operations can stop reconciling exports and start improving handoffs, routing, and conversion performance.

Why this matters financially
The business case gets stronger when you evaluate architecture, not just licence cost. HubSpot’s unified database architecture can deliver 30-60% lower total cost of ownership for RevOps dashboards than Salesforce’s multi-cloud setup, with implementation times of 4-8 weeks versus 3-6 months. For CA-based B2B firms, that translates to faster pipeline visibility and up to 40% fewer reporting errors, according to Landbase’s RevOps comparison of HubSpot and Salesforce.
That doesn’t mean every company should move everything into HubSpot. It means buyers should understand the operating cost of fragmented reporting before they approve another dashboard rebuild.
What strong providers understand early
A capable provider will push your team to decide where truth lives for each core object and metric. They’ll ask hard questions before any dashboard spec is approved:
- Lifecycle ownership: Is HubSpot the source for top-of-funnel progression, or does Salesforce override stage after handoff?
- Pipeline authority: Which system defines opportunity creation, stage movement, and closed revenue?
- Identity resolution: How will contact, account, and domain records be stitched when the same buyer exists in both systems?
- Access design: Which leaders need rep-level detail, and which should only see aggregated business intelligence reporting?
Practical rule: If a provider starts with dashboard mock-ups before a source-of-truth workshop, they’re treating a data architecture issue as a design exercise.
Some organisations also need a broader customer data strategy beyond dashboards. If your team is comparing operational reporting with enterprise-grade unification patterns, this Salesforce Data Cloud guide for engineering leaders is useful context for understanding when a native platform layer is enough and when a more formal data foundation is warranted.
A single source of truth isn’t about making reports look cleaner. It’s about removing negotiation from your go-to-market operating rhythm.
Defining Your Canonical Go-To-Market Data Model
A Head of Operations usually feels the cost of a weak data model in the QBR, not during implementation. Marketing reports one MQL number, sales disputes the conversion rate, finance has a different revenue figure, and the dashboard provider says the sync is working as designed. That failure starts earlier, in the model.
Your provider should deliver a canonical go-to-market data model before dashboard design begins. Treat it as a buying criterion, not a project nice-to-have. If a firm cannot show how it defines records, stage transitions, ownership rules, and metric logic across HubSpot and Salesforce, you are not evaluating a dashboard partner. You are evaluating a report builder.
Start with stage alignment
Stage alignment is where good projects get their shape. Get the leaders responsible for demand generation, SDR or BDR qualification, account executives, customer success, and RevOps in the same workshop. Define every stage in plain language, then document three things for each one: the entry rule, the exit rule, and the system that controls the change.
Keep the model tight.
Teams often over-design this step. They create extra lifecycle stages for edge cases, carry duplicate labels across both systems, or allow local process exceptions to become reporting logic. A better model supports how the business operates in practice, but still gives analysts one accepted path from first response to closed revenue.
One test works well. If two managers can read a stage definition and still classify the same record differently, the definition is not ready.
Define objects before metrics
Providers that know this work will push object design ahead of KPI design. That sequence matters because metrics only hold up when the underlying entities are settled first.
Document these object groups:
- Person objects such as lead, contact, and subscriber
- Company objects such as account, customer, and parent account
- Revenue objects such as deal, opportunity, quote, subscription, and renewal
- Activity objects such as form fills, meetings, emails, calls, and campaign responses
- Ownership objects such as SDR owner, AE owner, CSM owner, and territory assignment
Then assign a primary system of record for each object and for each major status change inside that object. In many B2B environments, HubSpot owns early engagement and inquiry management, while Salesforce owns opportunity progression and booked revenue. That split is workable. It fails when update rights, sync direction, and overwrite rules are left implicit.
If your team still needs to pressure-test how responsibilities should be divided across the two platforms, this Salesforce and HubSpot integration architecture guide is a useful reference point before you approve field mappings.
Build the metrics dictionary buyers should require
A provider should hand you a metrics dictionary before a single executive dashboard goes into design. That document is what lets your Head of Operations test whether reported numbers will stand up in pipeline review, forecast calls, and board reporting.
Use a baseline like this:
| Metric | Definition | Primary System of Record | Example Calculation |
|---|---|---|---|
| Subscriber | A person record captured through a form, import, or tracked conversion that has not yet met qualification criteria | HubSpot | Count of net new contacts entering Subscriber stage in the selected period |
| MQL | A person who meets the agreed marketing qualification threshold and entry rule | HubSpot | Count of contacts whose lifecycle stage changes to MQL |
| SAL | A qualified record accepted by sales for follow-up | Salesforce or HubSpot, depending on handoff design | Count of records marked accepted by sales after MQL |
| SQL | A record sales has validated as a real opportunity candidate under agreed criteria | Salesforce | Count of records entering SQL stage |
| Opportunity | A revenue-bearing sales record opened in Salesforce | Salesforce | Count of new opportunities created in period |
| Closed-Won Revenue | Revenue attached to opportunities marked closed-won | Salesforce | Sum of amount for closed-won opportunities |
| Lifecycle Conversion Rate | Rate at which records move from one canonical stage to the next | Derived in BI layer | Stage B entries divided by Stage A entries for the same cohort |
| Pipeline Coverage | Value of active pipeline relative to assigned target | Derived in BI layer | Open pipeline value divided by quota or target |
| Funnel Velocity | Time required for records to move across agreed lifecycle stages | Derived in BI layer | Median or average duration between stage timestamps |
| Marketing Influenced Pipeline | Pipeline associated with agreed marketing engagement logic | Derived in BI layer | Opportunity value linked to contacts meeting influence criteria |
The table is the starting point, not the deliverable. The essential check is whether every metric includes a date basis, inclusion rules, exclusion rules, owner logic, and conflict handling. Without that detail, teams will agree on the label and still dispute the number.
Required fields in the data dictionary
A usable dictionary has to work for operators, analysts, and system admins. Ask for these fields at minimum:
- Field label and API name, so technical teams can map the exact property or field
- Business definition, written in operating language instead of platform jargon
- Allowed values, especially for lifecycle stage, lead source, segment, region, and owner
- System authority rule, which states which platform can create, update, or override the value
- Transformation logic, including standardization, rollups, and BI-layer derivations
- Timestamp rule, which date is used for trend reporting and cohort analysis
- Exception handling, what happens when values conflict, arrive late, or are missing
This is also where providers should show discipline about future-proofing. If your business expects to add AI-assisted routing, enrichment, or qualification workflows, the model should leave room for machine-generated fields without letting them overwrite governed commercial data. Tools like Donely’s AI agents for business are a good example of why the model has to specify where automated actions can write data and where they should only suggest it.
The practical outcome is simple. A strong canonical model reduces metric disputes, shortens dashboard QA, and gives you a clear standard to judge any RevOps provider against.
Architecting Your HubSpot and Salesforce Integration
Once the canonical model is approved, the technical design becomes much simpler. There are three common integration patterns in a HubSpot and Salesforce environment. They are not equally good for RevOps analytics.

Pattern one uses native connectors
The native connector is usually the fastest route to basic operational sync. It works well for contact, company, and lifecycle field exchange when your field rules are disciplined and your reporting needs are modest.
Its weakness is analytics depth. Native sync is designed to move fields, not to create a canonical analytical model across campaigns, lifecycle history, opportunity objects, and subscription or billing data. Once teams ask complex questions about attribution, forecast coverage, cohort movement, or revenue ownership, native-only architecture starts to strain.
Pattern two uses point-to-point middleware
Middleware gives you more control. You can transform fields, trigger workflows, and orchestrate movements between systems. This approach is often useful for operational automations and exception handling.
The downside is sprawl. Over time, point-to-point logic becomes difficult to govern because business rules live in too many places. If one provider builds sync rules inside HubSpot workflows, another uses Salesforce automation, and a third adds middleware transformations, no one can explain why a metric changed without tracing multiple systems.
Pattern three uses a central analytics layer
For unified dashboards, this is usually the architecture to insist on. A central warehouse or analytics layer normalises records from HubSpot and Salesforce into one reporting model. It separates operational sync from analytical truth.
That matters because unified RevOps dashboards built on a normalized data warehouse or analytics layer can shrink forecast-error variance from about 25% in siloed dashboards to roughly 8–12%. This architecture joins CRM data from Salesforce with HubSpot engagement data on a common identifier, as described in Definite’s guide to RevOps analytics with HubSpot.
For analytics, don’t ask which platform has the prettier dashboard builder. Ask where the calculation logic lives, who owns it, and how it’s tested.
What the architecture should include
A provider that knows this space should propose a hub-and-spoke model with clear layers:
- Operational systems: HubSpot, Salesforce, and any billing or product data source.
- Sync and orchestration layer: Native connectors where appropriate, plus controlled orchestration for exceptions and enrichment. Teams exploring enrichment or workflow augmentation often also look at tools such as Clay’s orchestration platform and adjacent automation ideas like Donely’s AI agents for business when they want AI-assisted execution on top of clean GTM data.
- Staging layer: Raw extracts preserved before transformation.
- Canonical model layer: Standardised leads, contacts, accounts, opportunities, activities, owners, and revenue events.
- Presentation layer: Role-based unified dashboards built from the same model.
If you want a concrete view of the operational side of the connector itself, this HubSpot Salesforce integration reference is a useful implementation companion.
Real-time versus batch sync
Not every field needs the same sync behaviour.
Use near real-time handling for:
- Lifecycle handoff fields
- Lead assignment and routing
- Opportunity creation triggers
- Critical ownership updates
Use scheduled refresh patterns for:
- Executive dashboards
- Historical trend reporting
- Attribution models
- Cohort analysis and forecasting
Teams often overspend trying to make every metric instant. That usually increases complexity without improving decisions. Leadership doesn’t need every chart updated second by second. They need trusted business intelligence reporting on a stable schedule.
The right architecture keeps operational workflows responsive while keeping analytics clean, documented, and reproducible.
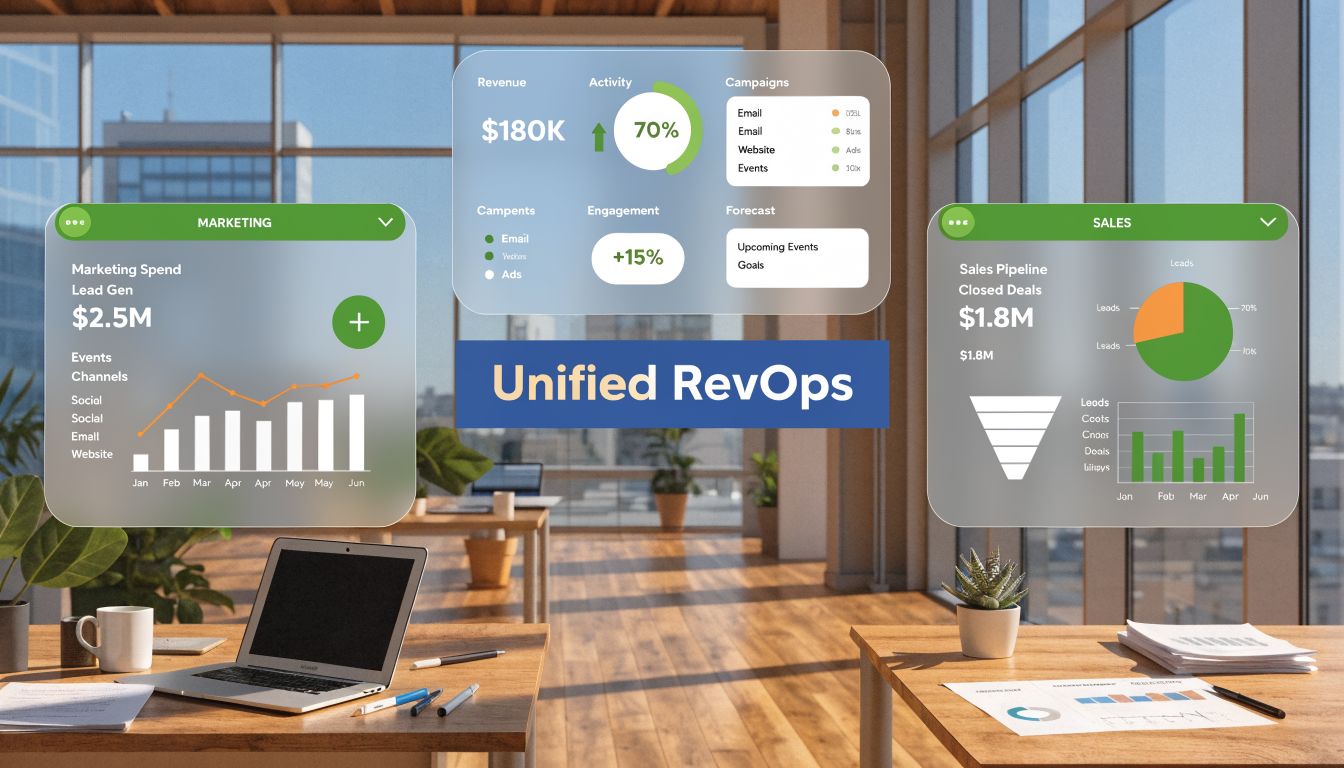
Designing Actionable Dashboards for GTM Teams
A unified data model doesn’t help if every dashboard looks like a system dump. Good dashboard design answers one question per audience: what decision should this person make next?
That’s where many revenue operations providers fall short. They can wire data together, but they don’t design for behaviour. Executives need signal. Marketing needs funnel diagnostics. Sales needs next-action visibility. If each audience gets the same dashboard with different filters, adoption drops fast.

Executive leadership dashboard
This dashboard should stay narrow. Leaders don’t need every campaign chart. They need a compact view of go-to-market performance metrics across the full revenue system.
A strong executive board usually includes:
- Lifecycle progression: Whether top-of-funnel volume is converting into sales-accepted and revenue-bearing stages.
- Pipeline health: Coverage, stage mix, age, and owner concentration.
- Forecast view: Expected outcomes versus target, using the canonical model rather than rep-maintained spreadsheets.
- Revenue movement: Closed-won trends and notable changes in conversion or velocity.
Use few visual types. Time series, stage conversion, and concise scorecards usually outperform dense dashboard grids.
Marketing funnel performance dashboard
Marketing needs a diagnostic instrument, not an executive summary. The most useful view connects campaign and channel activity to lifecycle movement in the shared model.
Design this dashboard so the team can answer:
- Which sources are creating high-quality records?
- Where are MQLs stalling before sales acceptance?
- Which segments are producing opportunities, not just form fills?
- Are handoff timestamps and ownership rules working as intended?
A unified architecture makes this possible because it ties HubSpot engagement and lifecycle data to downstream Salesforce opportunity outcomes. For practical inspiration on dashboard construction patterns inside the CRM layer, this guide on how to create dashboards in Salesforce is a useful operational reference.
Sales pipeline health dashboard
Sales dashboards should focus on execution, not vanity metrics. Reps and managers need to inspect active pipeline quality, stage ageing, conversion friction, and rep-level ownership clarity.
This dashboard works best when it includes:
- Open pipeline by stage and owner
- Stage ageing and stuck deals
- New opportunity creation trends
- Conversion from SQL to opportunity and from opportunity to closed-won
- Coverage relative to target
A dashboard becomes actionable when every chart can trigger a meeting, a workflow, or a manager intervention.
Preparing for predictive layers
Once the foundation is sound, you can layer predictive models on top. That trend is moving quickly, but most implementations still skip the architectural requirements.
According to iMark Infotech’s article on HubSpot Salesforce integration and RevOps engines, a 2026 survey found that 55% of mid-market RevOps leaders lack scalable models for forecasting, and unified dashboards that prioritise AI can cut implementation time by 40% but require hybrid data lakes. Treat that as a forward-looking planning signal, not a reason to bolt AI onto unstable reporting.
The practical implication is simple. If a provider talks about predictive scoring, forecasting, or AI summaries before they’ve defined identity resolution, metric governance, and warehouse logic, they’re selling an interface, not a system.
Implementing Security Governance and Data Quality
Most dashboard failures happen after launch. The build goes live, users trust it for a month, then exceptions pile up. A field changes. A sync rule breaks. A team creates a new lifecycle shortcut. Soon the dashboard still loads, but confidence is gone.
That’s why governance isn’t admin overhead. It’s what keeps unified dashboards usable.
Set access by role and decision rights
Role-based access control should follow business decisions, not tool convenience. Executives may need company-wide trend visibility but not rep-by-rep activity detail. Sales managers may need team pipeline inspection without access to every marketing workspace. Marketing may need attribution and lifecycle reporting without editing revenue logic.
A capable provider should document:
- Viewer groups: Who can see which dashboards and data cuts
- Editor rights: Who can change calculations, filters, or chart structure
- Sensitive fields: Which revenue, customer, or personal data should be restricted
- Approval rules: Who signs off on metric or model changes before release
Build a governance council that actually meets
A data governance council sounds formal, but it can be lightweight if it has the right people. Include RevOps, marketing ops, sales ops, CRM administration, and an executive sponsor. Give the group ownership of the canonical model and the authority to resolve future conflicts.
The council should review:
- New field requests
- Lifecycle rule changes
- Attribution logic updates
- Dashboard change requests
- Recurring data quality exceptions
For a practical operational framework, this resource on data governance best practices is a good companion.
Governance works when one team owns the decision, but every affected team understands the rule.
Automate quality checks
You shouldn’t rely on users to discover broken reporting. Put automated checks around the model instead.
Useful controls include:
- Sync failure alerts: Flag records that didn’t update as expected.
- Required field checks: Catch missing owner, source, stage, or close data.
- Volume anomaly monitoring: Surface unusual drops or spikes that may indicate mapping issues.
- Definition drift review: Detect new values appearing in controlled fields like lifecycle stage or lead source.
This is the maintenance layer buyers often forget to ask for when evaluating revenue operations providers. If the provider can’t explain how they’ll preserve trust after launch, the architecture isn’t complete.
Your Rollout and Adoption Checklist for Success
Even well-built unified dashboards fail when rollout is rushed. Teams don’t adopt dashboards because they exist. They adopt them when the data is trusted, the views fit their role, and training shows them what action to take.
A successful launch needs technical validation and human adoption in the same plan.
Technical acceptance checklist
Before broad rollout, insist on a formal validation pass.
- Metric validation: Confirm every dashboard metric matches the approved dictionary.
- Record tracing: Pick sample leads, contacts, accounts, and opportunities and follow them across HubSpot, Salesforce, and the BI layer.
- Filter testing: Validate region, owner, segment, and date filters against expected outputs.
- Permission testing: Confirm each user group sees only what it should.
- Refresh testing: Verify expected update timing and document known latency rules.
User acceptance checklist
User acceptance should focus on whether the dashboard helps each audience do its job.
- Executive review: Can leadership read the dashboard without a translator from ops?
- Manager workflow fit: Can sales and marketing managers use it in pipeline and performance reviews?
- Rep usability: Can frontline teams locate their own numbers and understand stage logic?
- Exception handling: Do users know where to report suspected data issues?
- Documentation check: Does each dashboard include metric definitions and owner notes?
Roll out in phases
Don’t launch to the entire company on day one. Start with a controlled group that can pressure-test the model and create internal credibility.
A sensible sequence is:
- Pilot group: Operations leads and power users validate core logic.
- Manager launch: Sales and marketing managers begin using dashboards in regular meetings.
- Leadership rollout: Executive reporting shifts to the new source of truth.
- Broader enablement: Frontline teams receive role-specific views and training.
Make adoption part of provider accountability
When you evaluate revenue operations providers, ask how they handle enablement after delivery. The answer should include training, office hours, change logs, dashboard documentation, and a process for enhancement requests.
If the provider’s scope ends at build completion, you’ll inherit the adoption burden internally. Sometimes that’s fine. But it should be a conscious decision, not an unpleasant surprise.
The teams that get long-term value from unified dashboards treat rollout as an operating change, not a reporting launch.
If you’re selecting a partner to design or rebuild your unified dashboard architecture across HubSpot and Salesforce, MarTech Do can help you pressure-test the data model, integration design, governance requirements, and rollout plan before you commit budget. That’s often the fastest way to de-risk a RevOps investment and make sure your dashboards are built on logic your whole GTM team can trust.