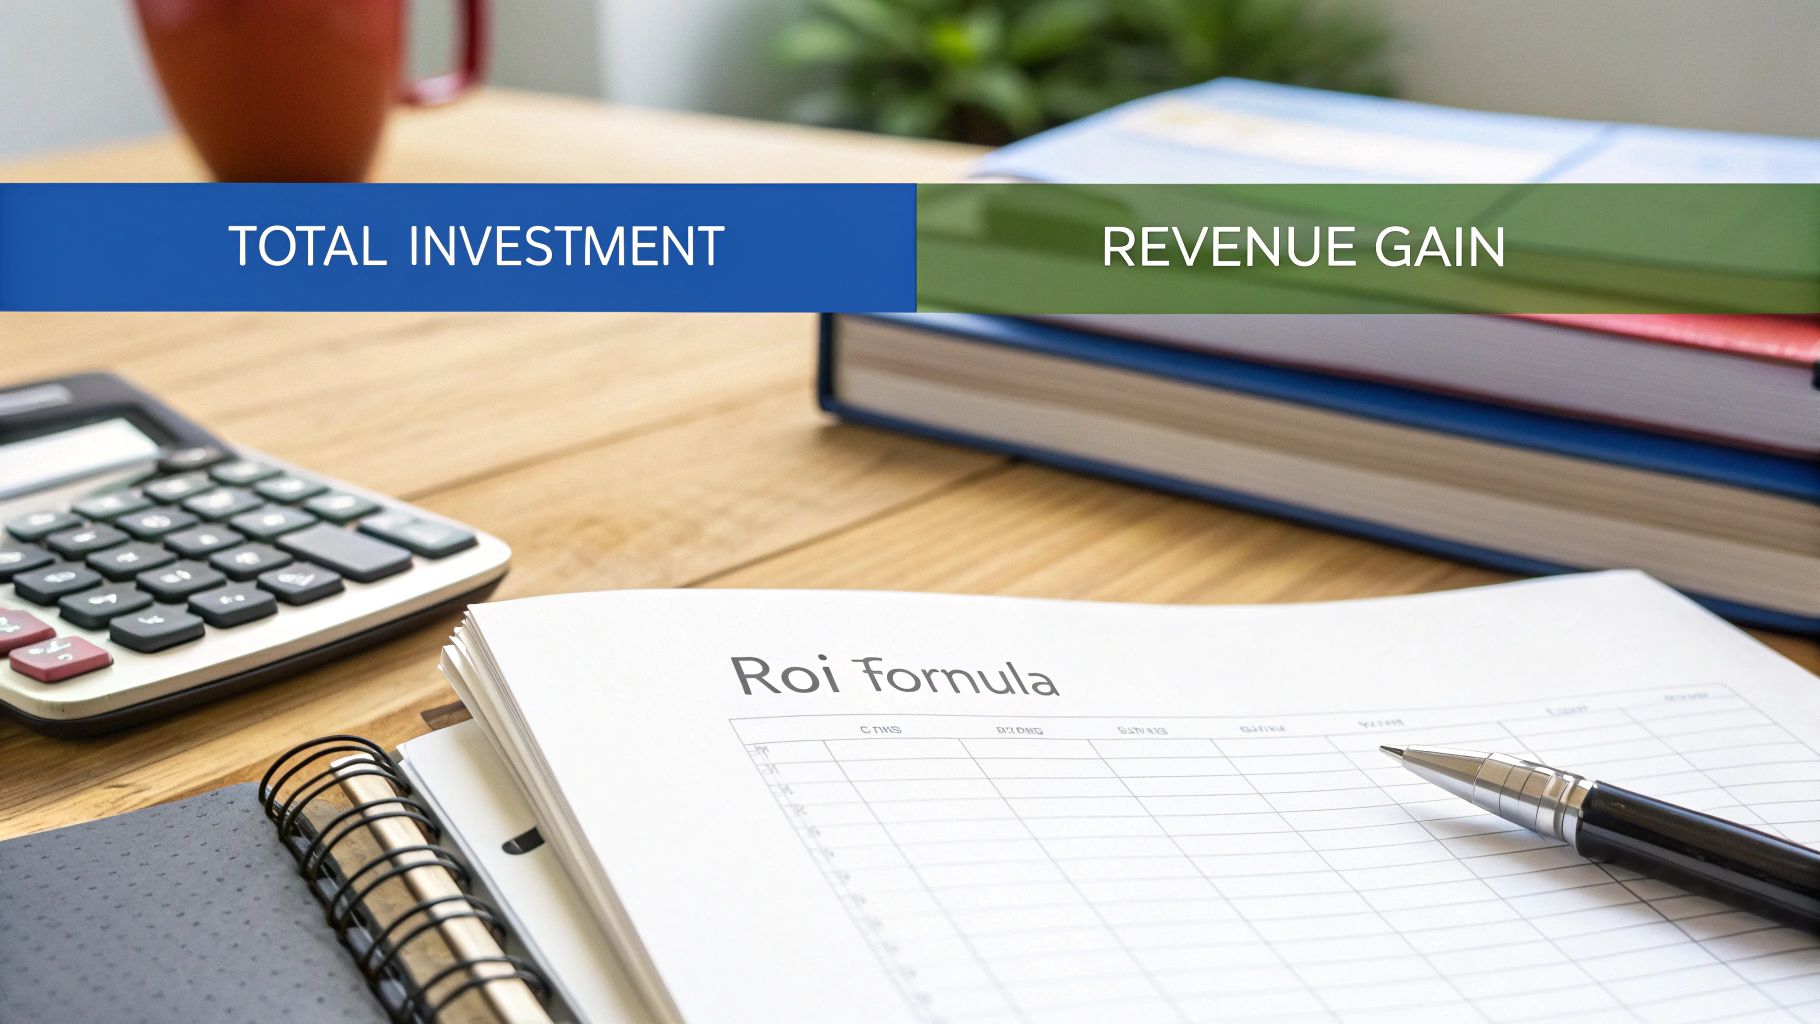
At its core, the simplest ROI Excel formula is =(Net Profit / Cost of Investment) * 100. This powerful calculation slices through complex performance data to deliver a straightforward percentage, showing you precisely what you got back from what you put in.
Why RevOps Teams Need a Bulletproof ROI Model
For professionals managing a B2B Salesforce or HubSpot stack, proving the value of our work isn’t a luxury—it’s essential for securing budget and driving strategy. A robust ROI model in Excel is more than a calculation; it’s the strategic tool we use to defend technology investments and propel the business forward.
It’s our job to answer tough questions from leadership. That new MarTech tool you championed? The CRM integration you guaranteed would streamline operations? Mastering ROI is no longer a finance-only task. For a modern RevOps leader, it is a fundamental skill.

From Raw Data to Real Decisions
A well-architected ROI model translates thousands of data points from your tech stack into a compelling success story. With it, you can finally:
- Secure Budget Approvals: Replace hope with proof. Present clear, data-backed projections for your next major marketing operations or system audit project.
- Optimize Spend: Pinpoint which campaigns and channels are generating revenue, allowing you to reallocate resources to what works.
- Align Stakeholders: Provide sales, marketing, and the C-suite with a single, undeniable metric for success.
- Demonstrate Value: Quantify the impact of your operational improvements, proving RevOps isn’t a cost center—it’s a growth engine.
This is more than theory. A recent analysis showed that B2B firms automating ROI tracking in their CRM and Excel workflows saw a 25% average increase in investment decision accuracy. That’s the tangible difference between guessing and knowing.
A bulletproof ROI model does more than just calculate profit. It builds credibility for your RevOps function, justifies technological investments, and provides the empirical evidence needed to steer the company’s growth strategy with confidence.
Before building a model that leadership will trust, you must gather the right inputs. Your calculations are only as reliable as the data you feed them. Here is a breakdown of what you’ll need to pull from your CRM and marketing automation platforms.
Key Inputs for a Credible RevOps ROI Calculation
| Component | What It Really Means for RevOps | Example from a Salesforce Campaign |
|---|---|---|
| Total Investment | This is every dollar spent—tool licenses, ad spend, agency fees, and the allocated cost of your team’s time. | $5,000 in LinkedIn Ads, $2,000 for a content agency, and 20 hours of internal team time at a blended rate of $75/hour ($1,500). Total = $8,500. |
| Gross Profit | The total revenue generated from the initiative minus the cost of goods sold (COGS). Never use top-line revenue alone. | The campaign generated $50,000 in new bookings. If COGS is 30%, the gross profit is $35,000. |
| Net Profit | This is your bottom-line result: Gross Profit minus your Total Investment. This is the “gain” in your ROI calculation. | $35,000 (Gross Profit) – $8,500 (Total Investment) = $26,500 Net Profit. |
| Attribution Data | The hard evidence from your CRM linking specific leads and closed-won deals back to your campaign. | Use Salesforce Campaign Influence reports to confirm that the $50,000 in bookings originated from leads whose first or primary touch was this LinkedIn campaign. |
Securing these four components is non-negotiable. They form the foundation of a credible ROI analysis that can withstand scrutiny from any CFO.
Ultimately, turning raw data from platforms like Account Engagement (fka Pardot) or HubSpot into a crisp ROI percentage is how you translate operational work into strategic influence. This principle holds true for any major initiative, as detailed in this helpful guide to AI adoption that drives real ROI, where a solid financial case is paramount to success.
Building Your Foundational ROI Formula in Excel
Let’s move from theory to a practical Excel setup. The foundation of any serious return on investment analysis is a straightforward formula, which serves as the starting point for more sophisticated models.
At its core, the ROI formula in Excel is: = (Net Profit / Cost of Investment)
When formatted as a percentage, this result provides a clear, comparable metric to gauge initiative performance. However, for RevOps and marketing operations professionals, “Net Profit” and “Cost of Investment” are the sum of numerous data points pulled from across the go-to-market tech stack.
Defining Your Key Inputs
Before entering data into a cell, you must define the full scope of your inputs. A common mistake is understating the investment, which produces a dangerously inflated and misleading ROI.
- Cost of Investment: This must be the total, all-in cost. It’s not just the ad spend you see in Google Ads. A proper RevOps calculation includes software licenses (like your HubSpot or Marketo Engage subscription), agency fees, content creation expenses, and the prorated salaries of team members who worked on the project.
- Net Profit: This is the revenue you can directly attribute to the initiative, after subtracting all investment costs. Pulling clean, accurate revenue data from a CRM like Salesforce Sales Cloud is non-negotiable. This is the real financial gain your work generated.
For instance, if you run a webinar campaign, your investment isn’t just the platform cost. It includes a fraction of your marketing automation license, the designer’s time, the copywriter’s fee, and the hours your demand generation manager spent on promotion.
Setting Up Your Excel Sheet
A clean, organized spreadsheet is your best defense against errors and ensures your model is scalable. A messy sheet is an error-prone sheet.
Let’s walk through a simple model for a recent webinar campaign.
- Label Everything Clearly: In Column A, create descriptive labels like ‘Revenue Generated’, ‘Marketing & Ad Spend’, ‘Software & Tools Cost’, ‘Team Labor Cost’, ‘Total Investment’, ‘Net Profit’, and ‘ROI %’. Clear labels ensure anyone can understand your workbook.
- Input Your Data: In Column B, next to your labels, enter the values gathered from your various systems.
- Sum Your Costs: In the cell next to ‘Total Investment’ (e.g., B5), use the
SUMfunction to add all costs. The formula would be=SUM(B2:B4). This makes your sheet dynamic; if you add another cost later, the total updates automatically.
With this structure, you have all the necessary building blocks in place.
Calculating and Formatting Your ROI
Now for the calculation. With your inputs neatly organized, you can implement the formulas.
First, calculate the net profit. In the cell next to ‘Net Profit’ (e.g., B6), subtract the total investment from your revenue. The formula is =B1-B5.
Finally, calculate the ROI. In the cell for ‘ROI %’ (e.g., B7), enter the formula: =(B6/B5). Excel will initially display this as a decimal, such as 0.75.
Key Takeaway: To make your report instantly useful to stakeholders, you must format this as a percentage. Select the cell, go to the ‘Home’ tab on the Excel ribbon, and click the percent style button (‘%’). That
0.75immediately becomes a much more intuitive 75%.
This formatting step is critical. It translates a raw number into a business metric that leadership can digest in seconds. A well-structured sheet with clear labels and properly formatted outputs is the foundation of any credible RevOps report.
Tailoring the ROI Formula for Marketing and Sales
The basic ROI formula is a solid starting point, but an effective RevOps team requires more than a single calculation. A generic formula cannot answer the specific, high-stakes questions that marketing and sales leaders face daily.
Is our latest Account Engagement (fka Pardot) nurture sequence performing? What is the true return on our paid media spend? Will today’s new customers deliver long-term value?
To answer these questions, we must adapt the core ROI excel formula for different contexts. These variations are practical tools for making smarter decisions about resource allocation, campaign optimization, and go-to-market strategy. When you tailor the formula, you transform a simple metric into a powerful diagnostic tool.
Calculating Campaign-Specific ROI
Every marketing campaign is a self-contained investment. Whether it’s a webinar series, a targeted email flow in Marketing Cloud Account Engagement (MCAE), or a content syndication program, each deserves its own P&L. The goal is to isolate a single initiative and determine its direct financial impact.
The formula is: =(Campaign Revenue - Campaign Cost) / Campaign Cost
The key to accuracy lies in the inputs.
- Total Campaign Cost: Think beyond direct ad spend. Tally everything: prorated team time, the allocated cost of software licenses (like your marketing automation platform), and any fees for external agencies or freelancers.
- Campaign Revenue: This requires solid attribution. You need a reliable method to connect closed-won opportunities in your Salesforce Sales Cloud back to the specific leads or contacts who engaged with that campaign.
Suppose you launched a new MCAE (Pardot) email nurture. Your total investment, including content creation and team time, is $7,500. By tracking leads through Salesforce, you can attribute $40,000 in new business directly to that effort.
In Excel, the calculation would be =(40000 - 7500) / 7500. The result is an impressive 433% ROI.
Measuring Return on Ad Spend (ROAS)
While Campaign ROI provides the full profitability picture, Return on Ad Spend (ROAS) focuses on the raw efficiency of your paid media channels. It answers one critical question: “For every dollar we spend on ads, how many dollars in revenue do we generate?”
The formula is lean: = (Revenue from Ad / Ad Spend)
ROAS is typically expressed as a ratio (e.g., 4:1) or a multiple (4x). To calculate this in Excel, you’ll need to export data from your ad platforms—such as Google Ads or LinkedIn—and cross-reference it with revenue data from your CRM.
For example, if you spent $10,000 on LinkedIn ads last quarter and can attribute $50,000 in revenue to them, the formula is =50000 / 10000. This yields a ROAS of 5x, meaning every dollar invested brought back five dollars. This clarity allows you to quickly compare channel performance and shift your budget effectively.
ROAS is a tactical metric for media efficiency. Campaign ROI is a strategic metric for overall profitability. A great RevOps team uses both to see the whole story—one tells you how the channel is doing, the other tells you how the entire initiative performed.
The Strategic LTV to CAC Ratio
For any B2B business, particularly those with a subscription model, the ratio of Customer Lifetime Value (LTV) to Customer Acquisition Cost (CAC) is arguably the most critical metric. This isn’t a simple snapshot of one campaign; it’s a measure of your go-to-market engine’s long-term health and scalability. A detailed guide on how to measure marketing ROI can offer more perspective on how these broader metrics fit together.
- LTV: The total revenue you can reasonably expect from a single customer over their entire relationship with your company.
- CAC: The total sales and marketing cost required to acquire that new customer.
A healthy business benchmark is a 3:1 ratio or better, meaning a customer’s total value is at least three times the acquisition cost. In Excel, you’ll need to pull data from Salesforce Sales Cloud to calculate these two figures separately before determining their ratio.
If your average LTV is $60,000 and your CAC is $15,000, your LTV:CAC ratio is a very healthy 4:1.
This metric is incredibly powerful. For example, B2B SaaS companies frequently use this ratio in investor pitches to demonstrate a sustainable growth model. The ability to show that the cost of acquiring a customer is significantly outweighed by their long-term value is a cornerstone of a sound revenue strategy. You can discover more insights about how firms calculate ROI with precision on bluecart.com and apply these principles directly to proving your acquisition model is sustainable through a strong LTV:CAC ratio.
Using Advanced ROI Models for Strategic Investments
While campaign-level metrics are crucial for daily optimization, RevOps leaders must also guide large-scale strategic decisions. A simple ROI calculation is insufficient when evaluating a complex, multi-year project like a full CRM migration or a major go-to-market engineering overhaul. For these, we need sophisticated models that account for the time value of money and staggered returns.
This isn’t about academic formulas; it’s about making sound, long-term decisions on capital allocation. Moving beyond a basic (Gain / Cost) formula provides a richer understanding of an investment’s true worth over its lifecycle. This is how you confidently compare a new Salesforce module against an external MarTech tool and prove which one delivers superior long-term value.

Annualized ROI for Multi-Year Projects
A raw ROI percentage can be misleading because it doesn’t specify the time it took to achieve that return. A 200% ROI in six months is excellent. The same return over five years is less impressive. Annualized ROI standardizes the return into a one-year equivalent, enabling a true apples-to-apples comparison of projects with different timelines.
The Excel formula is: =((1 + ROI) ^ (1 / N)) - 1, where N is the number of years.
Let’s say you invested $100,000 in a RevOps tech stack implementation that generated a total net profit of $150,000 over three years.
- First, calculate your total ROI:
=(150000 / 100000), which is 150% (or 1.5). - Now, use the annualized formula:
=((1 + 1.5) ^ (1 / 3)) - 1. - Excel will return 0.357, which translates to an annualized ROI of 35.7%.
This provides a much clearer view of the investment’s yearly performance, which is incredibly useful for stakeholder reports and setting future benchmarks.
Net Present Value (NPV) for Future Cash Flows
Net Present Value (NPV) is a powerful financial tool based on a simple principle: a dollar today is worth more than a dollar tomorrow due to inflation and opportunity cost. NPV calculates the current value of a series of future cash flows, including both returns and costs.
Excel’s NPV function simplifies this: =NPV(rate, value1, [value2], ...)
- Rate: Your company’s discount rate, often the cost of capital (typically 8-12%).
- Values: A series of cash flows over time. Your initial investment must be listed as a negative number outside the function itself.
Imagine evaluating a $50,000 investment in a new GTM engineering initiative using tools like Clay.com and ZoomInfo. You project it will yield net returns of $20,000 in Year 1, $25,000 in Year 2, and $30,000 in Year 3. Using a 10% discount rate, your Excel formula would be: =NPV(0.10, 20000, 25000, 30000) - 50000.
The result is $9,880. A positive NPV indicates the project is expected to generate value above your required rate of return, making it a financially sound investment.
A positive NPV is a green light. It signals that the projected earnings of an investment, discounted to today’s value, are greater than the initial outlay. It’s the gold standard for justifying strategic, long-term capital expenditures.
The power of this analysis is evident across industries. For example, after the 2014 downturn, energy companies heavily relied on the ROI Excel formula to vet capital projects. An analysis of approved projects revealed that this core financial validation led to smarter, more resilient investments in efficiency-driving technology. You can get a better feel for these capital allocation strategies from this YouTube breakdown of ROI in action.
Internal Rate of Return (IRR) for Break-Even Analysis
While NPV provides the absolute value of an investment in today’s dollars, the Internal Rate of Return (IRR) reveals the project’s intrinsic percentage return. It is the discount rate at which the project breaks even—the point where the NPV of all cash flows equals zero.
Excel’s IRR function is simple: =IRR(values)
Using the same GTM initiative example, your cash flows would be -$50,000 (initial cost), +$20,000, +$25,000, and +$30,000. With these values in cells A1 through A4, the formula =IRR(A1:A4) would yield an IRR of 21%.
The next step is to compare this 21% IRR to your company’s “hurdle rate”—the minimum acceptable rate of return. If your IRR is higher than your 10% hurdle rate, the project is approved. Using NPV and IRR together provides a complete picture, showing both the absolute dollar value and the percentage return of a strategic investment. This dual analysis is especially critical when evaluating costs that impact your overall customer acquisition strategy, which you can explore further in our guide to customer acquisition cost calculation.
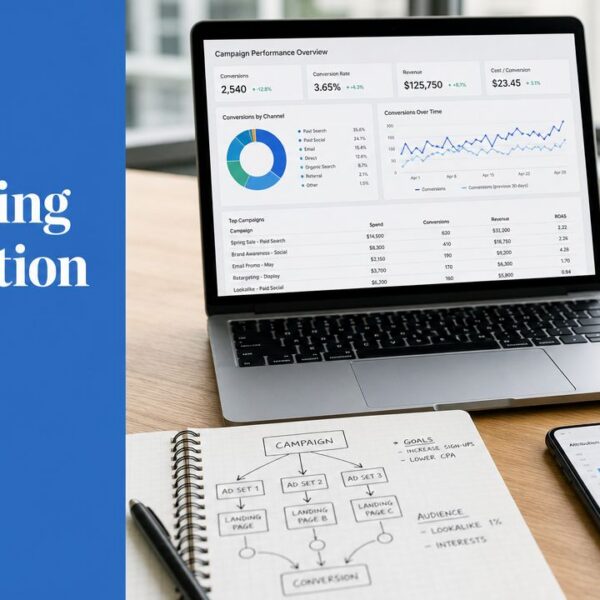
How to Automate and Visualize ROI Reporting
A spreadsheet of numbers is just data. To drive decisions, you need a visual, automated dashboard that tells a story. For RevOps professionals, this is how you elevate the ROI formula from a calculation to a strategic tool. It’s how you prove your value and influence the business’s direction, making your analysis sustainable and impossible to ignore.
The goal is to move beyond one-off reports and build a reusable template. A well-designed model allows you to run “what-if” scenarios in seconds. You can instantly answer questions like, “What happens to our ROI if the lead-to-opportunity conversion rate increases by 5%?” or “How would a 10% budget increase affect our projections?”

Building a Dynamic ROI Template
The key to a dynamic template is using cell references for all calculations. Instead of hardcoding numbers into formulas, point them to input cells for costs and gains. This simple change makes your model flexible and allows it to update automatically as you feed it new data.
Your template should have a dedicated input section for key variables:
- Investment Costs: Segment by category, such as ad spend, software licenses, or team labor.
- Key Performance Indicators: Track metrics like leads generated, conversion rates, and average deal size.
- Revenue Generated: The top-line figure attributable to the initiative.
This structure makes modeling different outcomes straightforward. You can change a single input—like cost per click or number of new customers—and instantly see the impact on your final ROI percentage.
Error-Proofing Your Dashboards
When pulling data from systems like Salesforce or HubSpot, gaps and errors are inevitable. Nothing undermines a presentation faster than a #DIV/0! error because an incomplete campaign cost broke your dashboard. The IFERROR function is a RevOps professional’s best friend.
Wrap your core ROI calculation in this function to provide a fallback plan. The syntax is simple: =IFERROR(your_formula, value_if_error).
Instead of =C2/B2, you would use =IFERROR(C2/B2, "Data Missing"). This replaces jarring error messages with a clean, custom note, keeping your dashboard readable and preventing minor data glitches from derailing your meeting.
A clean, error-free dashboard builds trust. Using functions like
IFERRORis a small technical step with a huge impact on how reliable and professional your reporting feels. It shows you’ve thought ahead and built a truly robust model.
Turning Data into a Visual Story
With your data clean and your model dynamic, it’s time for visualization. Numbers in a grid are difficult to digest; charts and graphs make findings instantly clear. Excel offers excellent tools for bringing ROI data to life.
- Bar Charts are perfect for comparing the ROI of different marketing campaigns side-by-side, immediately highlighting top performers.
- Line Charts are ideal for tracking ROI over time, providing a clear view of performance trends for long-term projects.
- Pie or Donut Charts effectively break down total investment costs, showing stakeholders exactly where their money is going.
Combining these visuals into a simple dashboard creates a powerful, one-page performance summary. For RevOps leaders, this is often the most effective way to communicate strategic value to the C-suite. While Excel is a workhorse, these principles apply everywhere. If your team operates primarily within your CRM, it’s worth learning how to create dashboards in Salesforce to centralize reporting. For those seeking more advanced capabilities, a dedicated Financial Insights Dashboard can offer real-time metrics and sophisticated visualizations.
Frequently Asked Questions About ROI in Excel
When working with ROI calculations in Excel, you will encounter unique scenarios. Here are common questions from RevOps and marketing professionals, with practical answers.
How Do I Account for Non-Financial Returns?
While the standard ROI formula is purely financial, qualitative wins cannot be ignored. Benefits like enhanced brand awareness or improved customer satisfaction are valuable and should be presented alongside hard numbers.
Start by tracking KPIs that reflect these gains, such as social media engagement, Net Promoter Score (NPS), or organic website traffic. In your Excel report, create a separate section for these “soft” metrics. While you can’t plug them into the =(Gain-Cost)/Cost formula, presenting them concurrently provides leadership with a complete picture of an initiative’s true impact.
What’s the Biggest Mistake in Calculating Marketing ROI?
The most common and dangerous mistake is understating the true investment cost. It’s easy to count only direct ad spend, but this ignores numerous indirect expenses. This oversight dangerously inflates your ROI and can lead to flawed strategic decisions.
A rock-solid ROI calculation must include every associated cost. This means factoring in software licenses for tools like Salesforce and HubSpot, content creation expenses, agency retainers, and the prorated salaries of team members involved.
A simple way to avoid this is to build a comprehensive cost checklist into your Excel template. This small step ensures every expense is counted, yielding an ROI figure you can trust.
How Can I Track ROI for Long B2B Sales Cycles?
With long sales cycles, attribution becomes complex. The key is to tie revenue back to when the lead was first generated, not just when the deal closes months later. The best tool for this is cohort analysis.
In Excel, group leads that entered your pipeline during a specific period (e.g., Q1) and track that cohort’s progress over time. Using functions like VLOOKUP or INDEX/MATCH, you can link closed-won revenue from a Salesforce export back to the original campaign and date. This creates a time-lagged ROI that provides a more accurate read on marketing performance, even when the payoff is not immediate.
Can I Use a Pivot Table to Compare ROI Across Campaigns?
Absolutely. Pivot tables are perfect for this, allowing you to slice, dice, and compare performance across many initiatives without writing manual formulas.
First, organize your data in a simple, flat table with columns for ‘Campaign Name,’ ‘Total Investment,’ ‘Generated Revenue,’ and ‘Net Profit.’ Once that’s set up, creating the pivot table is straightforward.
- Drag ‘Campaign Name’ into the ‘Rows’ area.
- Go to ‘PivotTable Analyze’ > ‘Fields, Items, & Sets’ and add a ‘Calculated Field.’
- Use the formula
=('Generated Revenue' - 'Total Investment') / 'Total Investment'.
This creates a clean, dynamic report comparing the ROI for all your campaigns, ready for quick analysis and smarter decisions.
Ready to move beyond spreadsheets and truly align your marketing, sales, and revenue operations? MarTech Do specializes in auditing and optimizing the Salesforce and HubSpot stacks for B2B companies, ensuring your technology drives measurable growth. Book a consultation with us today.